Figures & data
Table 1. Mean body weight variation for acute study (weight in grams (g)).
Figure 1. Acute body weight of female rats monitored for up to 14 days per OECD guidelines 423, showing no significant difference from start to end of the study.
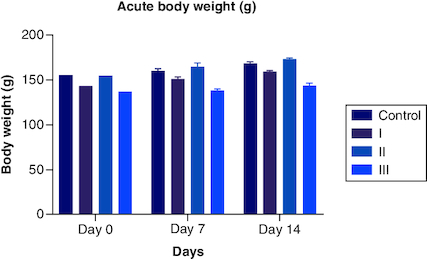
Table 2. Mean body weight variation for sub-chronic study.
Table 3. Significant changes of hematological parameters of wistar rats orally administered with PHF for 90-days and a 30-day post treatment recovery studies.
Table 4. Significant changes of Liver Function Test of wistar rats orally administered with PHF for 90-days and a 30-day post treatment recovery studies.
Table 5. Renal/kidney function test of wistar rats orally administered with PHF for 90-days and a 30-day post treatment recovery studies.
Figure 2. Body weight variation in males from a period of 0th week to 13th weeks after the dosage of PHF tablet.
Body weight variation in females from period of 0th week to 13th weeks after the dosage of PHF tablet.
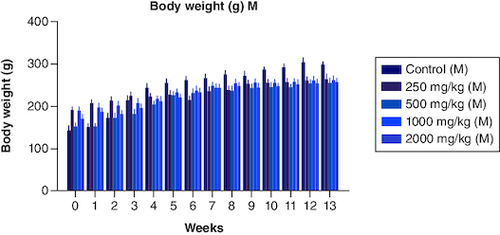
Figure 3. Food intake variation in males from period of 0th week to 13th weeks after the dosage of PHF tablet.
Food intake variation in females from period of 0th week to 13th weeks after the dosage of PHF tablet. Mean absolute organ weight in males after dosage of PHF tablet. Mean absolute organ weight variation in females after dosage of PHF tablet.
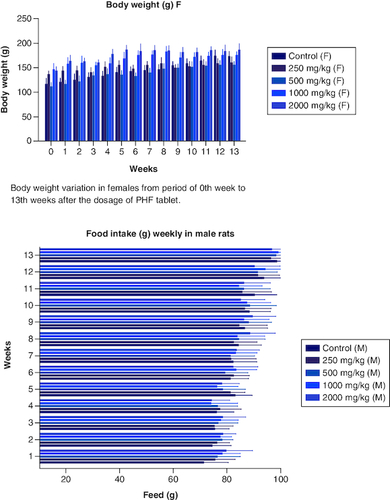
Table 6. Food intake of Wistar rats post dosage for over a period of 90 days (week 0 to week 13).
Table 7. Absolute Organ weight wistar rat post sub-chronic toxicity study.
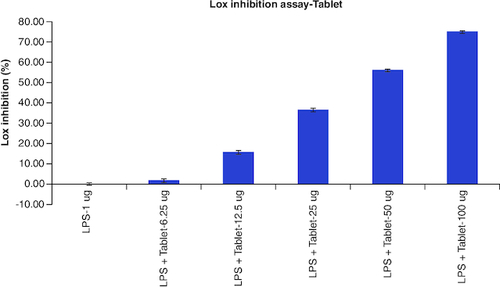
Table 8. Overlaid tabular column represented the Lox enzyme inhibitory effect of Tablet in comparison to the Diclofenac in LPS induced Murine macrophage (Raw 264.7) cells.
Figure 4. Represent the micrograph of the various vital organs from the control group.
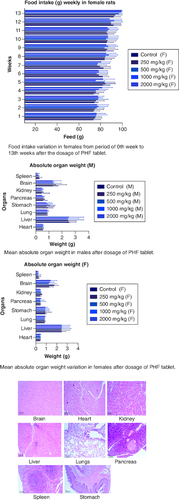
Figure 5. Represent the micrograph of the various vital organs from the group consuming 250 mg/kg of PHF tablet.
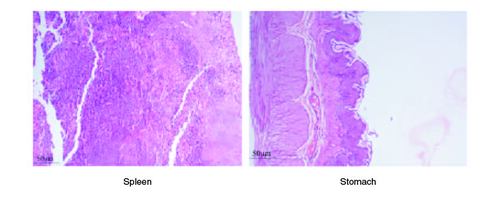
Figure 6. Represent the micrograph of the various vital organs from the group consuming 500 mg/kg of PHF tablet.
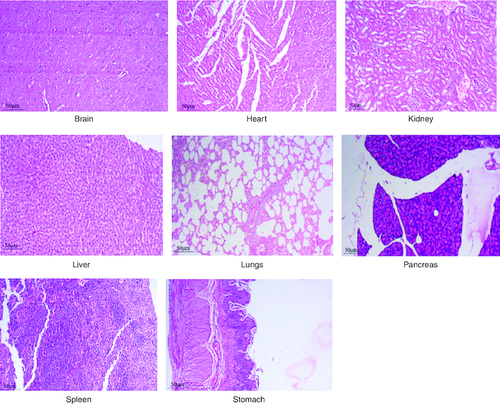
Figure 7. Represent the micrograph of the various vital organs from the group consuming 1000 mg/kg of PHF tablet.
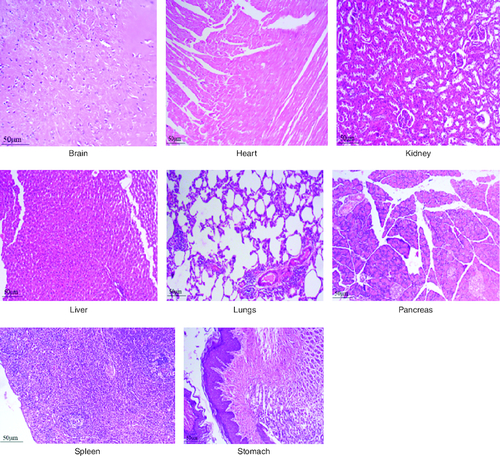
Figure 8. Represent the micrograph of the various vital organs from the group consuming 2000 mg/kg of PHF tablet.
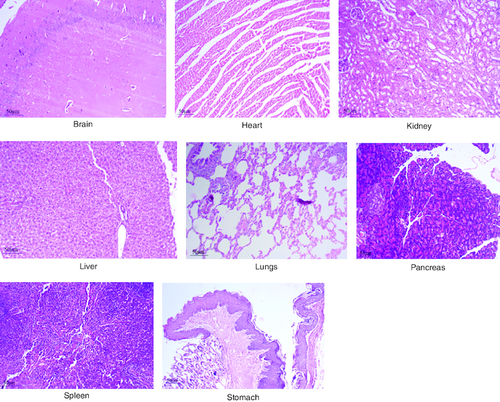
Figure 9. Lox enzyme levels observed in LPS alone, Diclofenac with different concentrations treatment on LPS-induced Raw 264.7 cells after the incubation period of 24 h.
Each assay was performed in duplicate and the experiments were repeated once.
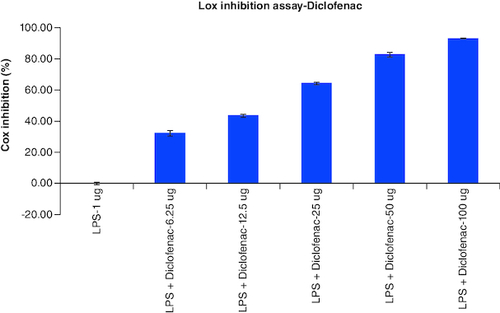
Figure 10. Lox enzyme levels observed in LPS alone, tablet with different concentrations treatment on LPS-induced Raw 264.7 cells after the incubation period of 24 h.
Each assay was performed in duplicate and the experiments were repeated once.