Figures & data
Table 1. Patients' characteristics and treatments.
Table 2. Neoadjuvant chemotherapy information.
Table 3. Recurrence, metastasis and death.
Figure 1. Kaplan-Meier survival curve in triple-negative breast cancer patients.
High Ki-67 expression index was remarkably linked with poorer DFS (log-rank p = 0.039; A) and OS (log-rank p = 0.029; B). The lymph node stage was also substantially correlated with worse DFS (log-rank p < 0.001; C) and OS (log-rank p < 0.001; D). (A) Disease-free survival curve of the Ki-67 group; (B) overall Survival curve of the Ki-67 group; (C) disease-free survival curve of the lymph node stage group; (D) overall survival curve of the lymph node stage group.
DFS: Disease-free survival; N0: no lymph node metastases; N1: One to three axillary lymph node metastases; OS: Overall survival.
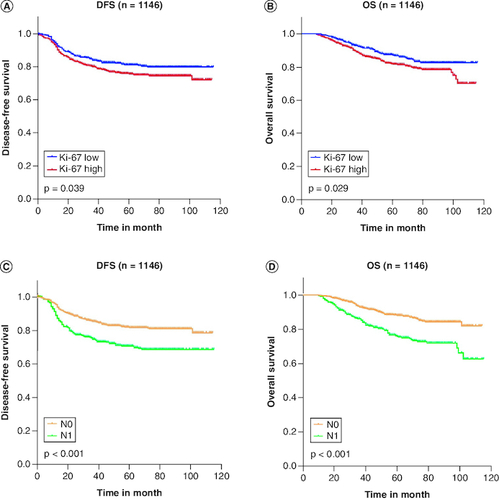
Table 4. The Univariate and Multivariate Analysis of DFS and OS.
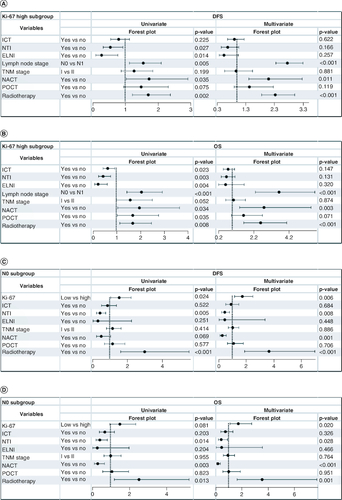
Figure 2. Subgroups of the univariate and multivariate analysis in the Ki-67 high group and N0 group.
The adjusted p-value and hazard ratio were obtained from the Cox regression model. (A) Analysis for disease-free survival in the Ki-67 high group; (B) analysis for overall survival in the Ki-67 high group; (C) analysis for disease-free survival in the N0 group; (D) analysis for overall survival in the N0 group.
DFS: Disease-free survival; ELNI: Extra lymph node invasion; HR: Hazard ratio; ICT: Intravascular cancer thrombosis; N0: No lymph node metastases; NACT: Neoadjuvant chemotherapy; NTI: Nerve tract invasion; OS: Overall survival; POCT: Postoperative chemotherapy.