Figures & data
Figure 1. Strategy and materials in this study.
(A) Diagram of the procedure in the study. The primary tumor cells and tumor organoids were generated from patients' tumor tissues and ROBO1-NK were constructed from patients' PBMCs. (B) IHC of ovarian tumor tissues. Negative control was used irrelevant IgG replacing primary antibody for incubating. Strong positive of ROBO1 expression on cell membrane was marked by red circles. (C) ROBO1 positively expressed in tumor tissues of the clinical ovarian cancer patient #01, #02, #03 and #04.
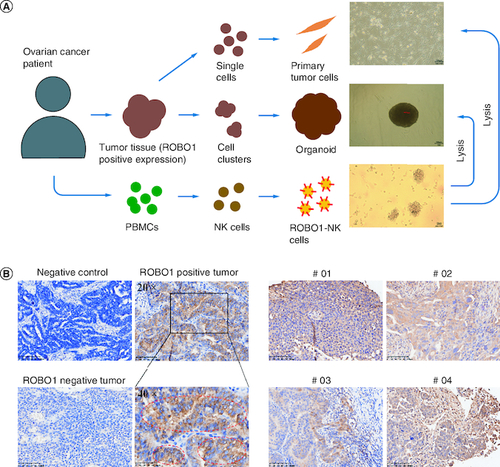
Figure 2. Characters of ROBO1-NK cells.
(A) Morphology comparison of PBMCs (upper panel), PBMC-NK cells (mid panel) and ROBO1-NK cells (bottom panel) under bright field. (B) Biomarkers determination of ROBO1-NK cells by flow cytometry. For the biomarkers CD34, CD45, CD3, CD56 and CD16, negative controls were used irrelevant IgG replacing primary antibody for incubating, presented as red peaks. For the ROBO1-CAR detection, negative control was used PBMC-NK incubating with anti-CAR antibody, presented as red peak. Samples in detection were presented as blue peaks.
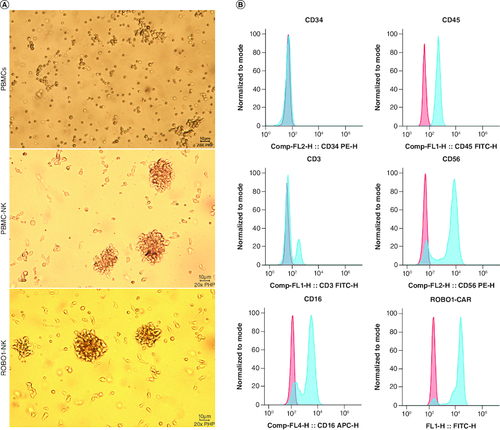
Figure 3. ROBO1-NK lyse ovarian cancer cell line and primary cancer cells.
(A) Positive expression of ROBO1 on SKOV-3 cells. (B) Rate of SKOV-3 cell lysis with different E-T ratio. E: number of effective cells; T: number of target cells. (C) Time curve of different NK cells, including Mock-CAR-NK (blue), PBMC-NK (green), ROBO1-NK (red) and control (medium, black), lysing SKOV-3 cells. (D) Lysis rate of primary ovarian tumor cells from patient #01, #02, #03 and #04 by PBMC-NK and ROBO1-NK after 24 h, detected with CCK-8 assay. (E) Photograph of PBMC-NK and ROBO1-NK lysing efficacy on primary ovarian tumor cells after 48 h co-culturing. The primary cells were presented as spindle-like form while NK cells were spherical form with clusters.
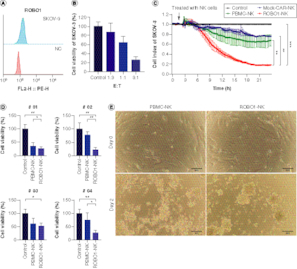
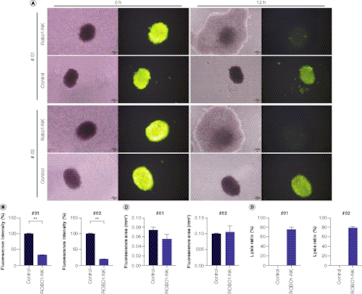
Figure 4. Detection of ROBO1-NK lysing ovarian cancer organoids.
(A) Bright field and fluorescent images of organoids after treatment with ROBO1-NK cells or medium as control. Organoids presented as lager spherical form with green fluorescence, ROBO1-NK cells presented as smaller spherical form around the Organoid without fluorescence. The photographs were taken at the beginning of h 0 to the lysis finishing of h 12. (B) Quantification of fluorescence intensity of organoids, indicating the cells viability in organoids. (C) Quantification of fluorescence area of organoids. (D) Calculation of lysis ratio of organoid after treatment with ROBO1-NK cells.