Figures & data
Figure 1. The composition of immune cells assessed by CIBERSORT algorithm in glioblastoma.
(A & B) The identification of prominent tumor-infiltrating immune cells related to GBM. (C) The CIBERSORT fraction of immune cells. The blue and yellow boxes stand for the normal group and primary tumor group, respectively.
CIBERSORT: Cell type identification by estimating relative subsets of RNA transcripts.
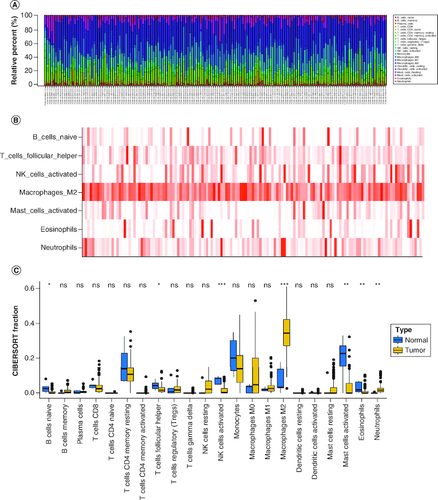
Figure 2. Weighted gene co-expression network analysis based on differential immune infiltration cells.
(A) Cluster dendrogram. Genes are divided into various modules by hierarchical clustering, and different colors represent different modules, among which gray defaults to genes that cannot be classified into any module. (B) The heatmap of modules and immune cells correlation. In the figure, red represents a positive correlation and cyan represents a negative correlation. The darker color indicates a stronger correlation. Each frame labels the correlation coefficient, with the corresponding p-value in brackets. (C) The scatter plots show the correlation between module membership (x-axis) and gene signature (y-axis) in B cells and macrophages M2, related to all three types of immune cells were obtained by taking the intersection.
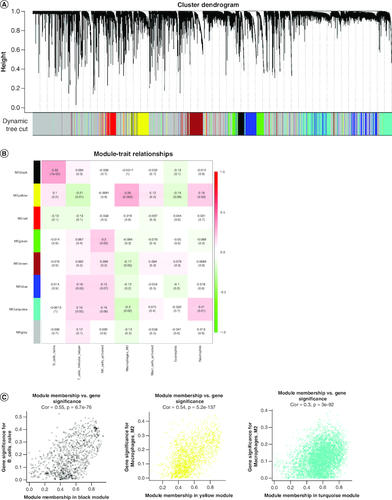
Figure 3. Construction of the immune-related genes prognostic signature for GBM patients.
(A & B) Construction LASSO regression model based on SLC7A11-related immune-related genes in the training cohort. (C) Univariate Cox regression analysis of immune-related genes in GBM. (D) Correlation analysis between SLC7A11 and prognostic gene signature.
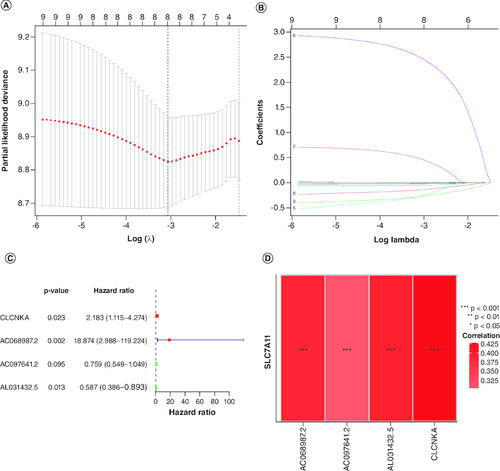
Figure 4. Evaluation of the prognosis prediction power of the four gene signature in the training group.
(A) Distribution of risk score. (B) Survival status of GBM patients with high and low-risk scores. (C) The expression profiles of the four gene signatures. (D) Overall survival analysis of the high- and low-risk groups. (E) Time-dependent ROC curve of the signature.
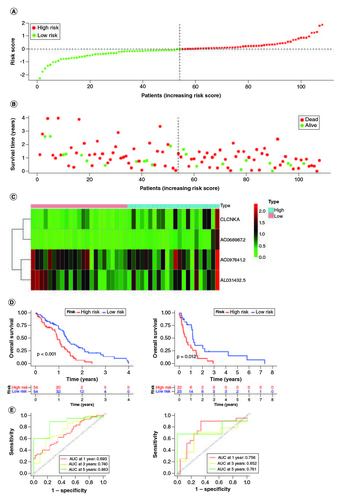
Figure 5. Validation of the correlation with TMB and risk score of disulfidptosis-related gene signatures in GBM patients.
(A & B) The waterfall plot shows the mutation landscape of the top genes in GBM patients with low-risk scores and high-risk scores. (C & D) Kaplan–Meier survival curves revealed the prognostic value of TMB with or without combination with the risk score in GBM patients.
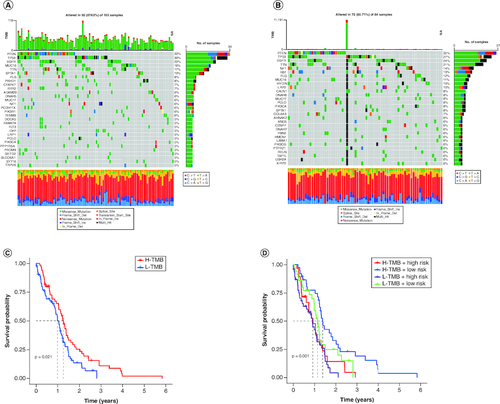
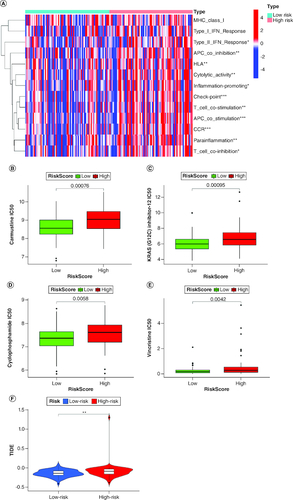
Figure 6. Characterization of immune infiltration in high- and low-risk GBM patients.
(A) Correlation analysis among each immune cell proportions in GBM. (B–E) Sensitivity analysis between the high-risk and low-risk groups for four drugs: carmustine, KRAS(G12C), cyclophosphamidec, and vincristine. (F) Tumor immune dysfunction and exclusion (TIDE) analysis between the high-risk and low-risk groups.