
Figures & data
Figure 1. PRISMA flow chart.
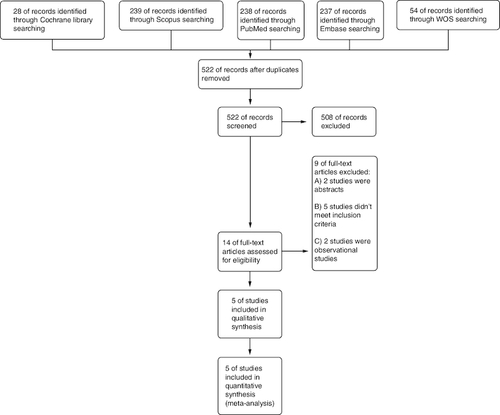
Figure 2. Summary of risk of bias assessment of the included studies.
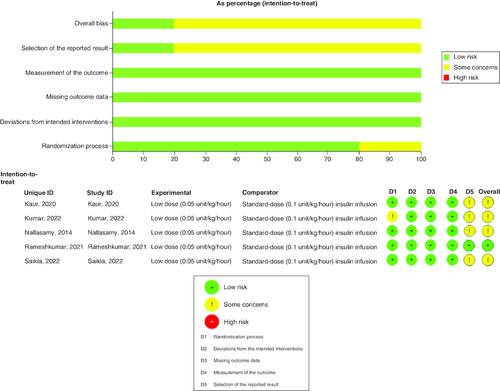
Table 1. Summary of the included studies.
Table 2. Baseline characteristics of the enrolled patients in the included studies.
Figure 3. A Forest plot of the time to reach blood glucose ≤250 mg/dl.
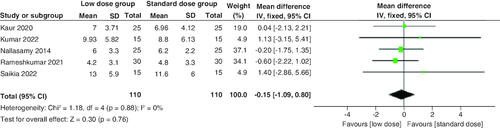
Figure 4. Forest plot of the time to resolution of acidosis (h).
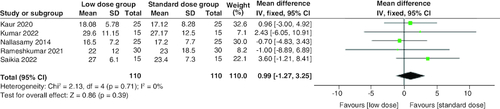
Figure 5. Forest plot of rate of blood glucose decrease until level is ≤250 mg per dl per hour.
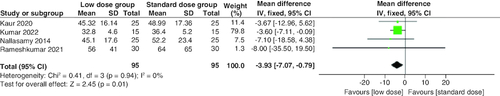
Figure 6. Forest plot of the incidence of hypokalemia.
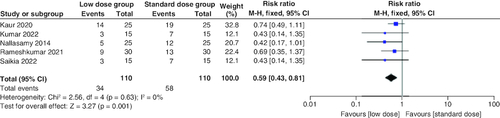
Figure 7. Forest plot of the incidence of hypoglycemia.
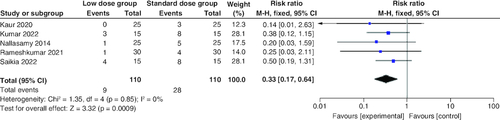
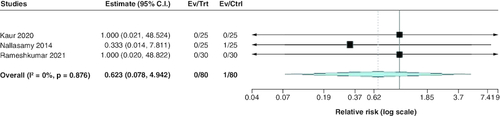
Figure 8. Forest plot of the incidence of treatment failure.
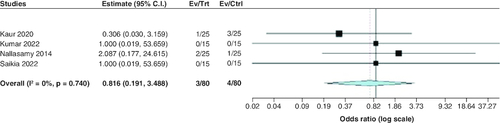
Figure 9. Forest plot of the incidence of cerebral edema.
Supplemental material