Figures & data
Table 1. Primers sequences.
Table 2. siRNA sequences.
Figure 1. The IC50 of gemcitabine on PANC-1 cell line.
n = 3.
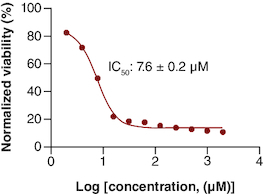
Figure 2. Interactions and silencing efficacy of the targeted genes.
(A) Protein–protein interaction using STRING database, the PPI enrichment p-value: 0.0681. (B) Relative normalized expression of Notch1 siRNA, ANGPTL4 siRNA, NF-κβ1 siRNA in cells transfected with 100 nM siRNA targeting each gene's mRNA. The results normalized to scrambled-siRNA.
n = 3, values are (mean ± SD).
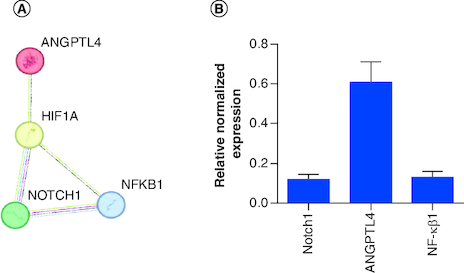
Figure 3. The dose-dependent assay for siRNAs (Notch1, scrambled (SC), ANGPLT4 and NF-κβ1) from left to right, respectively.
siRNAs compared with mocked transfected PANC-1 cell line. Significant differences compared with SC siRNA.
***p < 0.001; ****p < 0.0001.
n = 3, values are (mean ± SD); ns: Not significant.
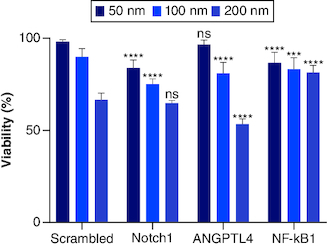
Figure 4. (100 nM) of each single siRNA with 6 μM gemcitabine compared with mocked transfected PANC-1 cell line.
n = 3, values are (mean ± SD). Significant differences compared with SC siRNA + Gemcitabin. Statistical significance: **** indicates p < 0.0001.
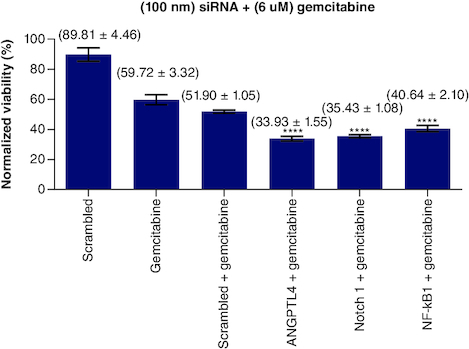
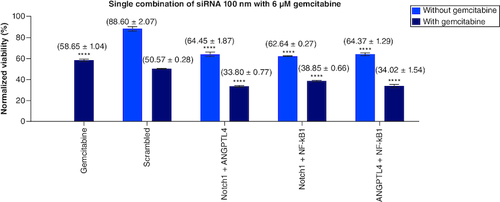
Figure 5. NF-κβ1, Notch1, ANGPTL4 (100 nM) single combinations with 1:1 molar ratio with and without 6 μM gemcitabine compared with mocked transfected PANC-1 cell line.
Significant differences compared with SC siRNA.
****p < 0.0001.
n = 3, values are (mean ± SD).