
Figures & data
Figure 1. A comparison between high-risk and low-risk groups.
(A) A bar plot for the frequency of surgery choice between risk group. (B) A box plot showing a significant difference in age between risk groups.
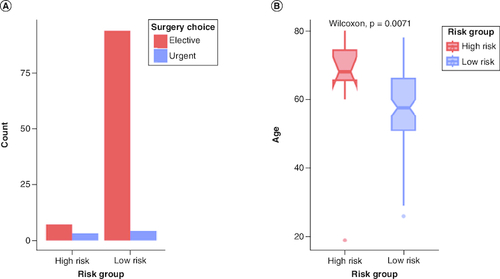
Table 1. Demographic and clinical characteristics of patients included in the study.
Figure 2. Scatter plots for the significant correlations between intra- and post-operative variables and the EuroScore.
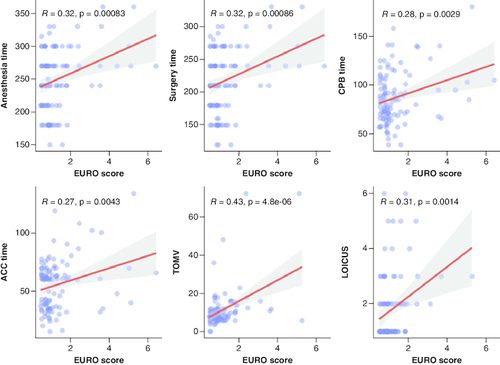
Figure 3. Boxplots for significant correlated intra-operative variables with risk groups.
(A) High-risk group showed a significantly higher anesthesia time than low-risk group (p = 0.01). (B) High-risk group also showed a significantly higher surgery time (p < 0.01). (C) Partial significance in CPB time in which the high-risk group showed longer CPB time. (D) Bar graph showing the frequency of IMA harvesting between risk group where most of the low-risk group had LIMA harvest.
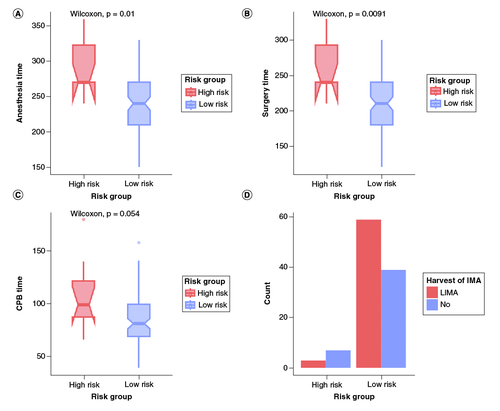
Table 2. Intra-operative variables between risk groups.
Table 3. Post-operative characteristics.
Figure 4. Machine learning models performance.
(A) Area under the Receiver Operating Characteristic curve (AUC/ROC) for RFC29 and RFC8 models. The RFC8 model showed better performance and higher AUC. (B) Permutation importance based on the decrease in model's score when the feature is shuffled. Higher values indicate higher importance and contribution to model's prediction. Post-operative complications, aortic cross clamp time, age and cardiopulmonary bypass time showed higher contribution.
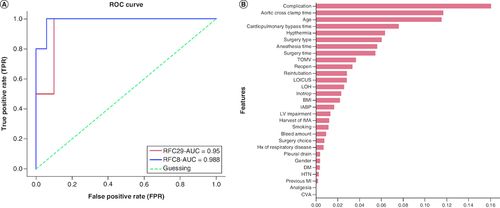
Table 4. Evaluation metrics for machine learning models.