
Figures & data
Figure 1. Median survival in days according to type of malignancy.
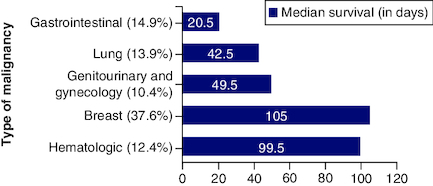
Table 1. Baseline characteristics.
Table 2. Distribution of LENT categories and median survival.
Figure 2. Survival functions according to LENT score (low, moderate and high) risk.
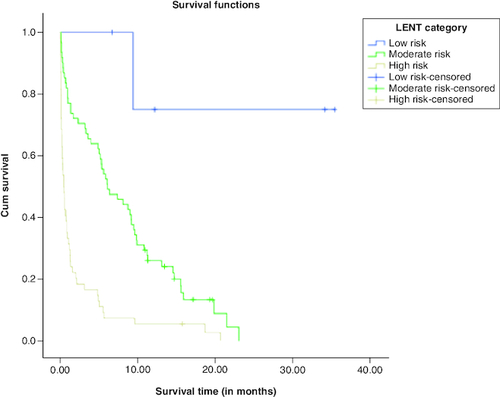
Figure 3. Bar chart of mortality versus LENT score (low, moderate, high) risk.
(A) 1-month mortality, (B) 3-month mortality (C) 6-month mortality.
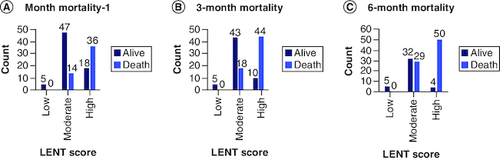
Figure 4. ROC curve for LENT score for the outcome of mortality.
At (A) 1-month mortality (B) 3-month mortality (C) 6-month time periods. AUC was 0.74, 0.78 and 0.79, respectively. All p-values <0.001.
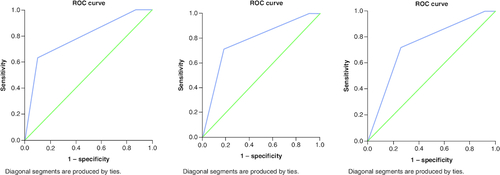
Table 3. Predicted death probability for LENT scores; 1 month, 3 months and 6 months mortality groups.