Figures & data
Table 1. Size distribution of goldenberry-derived exosome-like nanoparticles.
Figure 1. Transmission electron microscopy of GDEN with magnification.
200.000× (A), 100.000× (B) and (C).
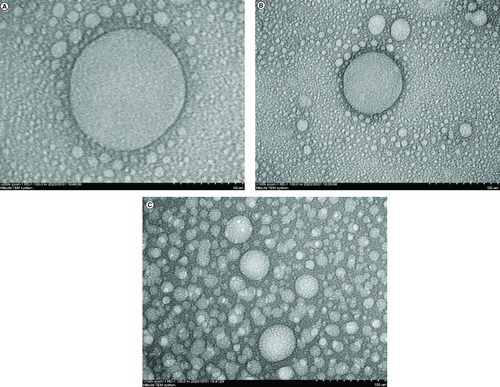
Figure 2. Percentage of RAW 264.7 viability after being treated with GDEN in various concentrations.
Each treatment was compared with control, *p-value < 0.05; **p-value < 0.01; ***p-value < 0.001 (n = 3).
GDEN: Goldenberry-derived exosome-like nanoparticles.
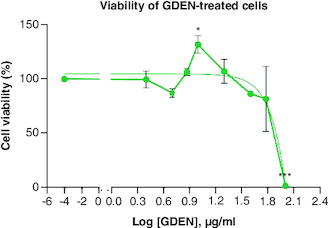
Figure 3. Confocal microscopy of GDEN uptake by RAW 264.7 cells after 2 and 6 h incubation period, magnification of 200×.
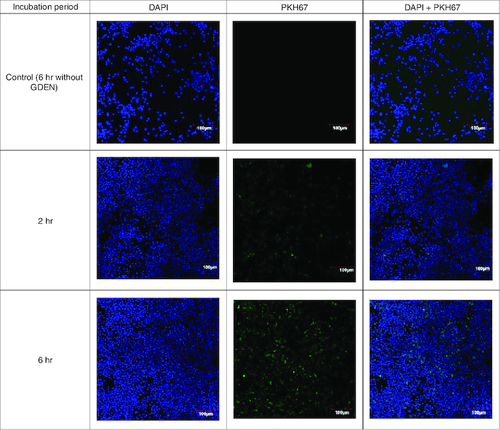
Figure 4. Confocal microscopy of GDEN uptake by RAW 264.7 cells during 6 h incubation period, magnification of 400×.
Goldenberry-derived exosome-like nanoparticles (GDEN) (green) was observed around the nucleus (blue) (A), further observation with bright-field overlay confirmed the internalization of GDEN into the cell cytoplasm (B).
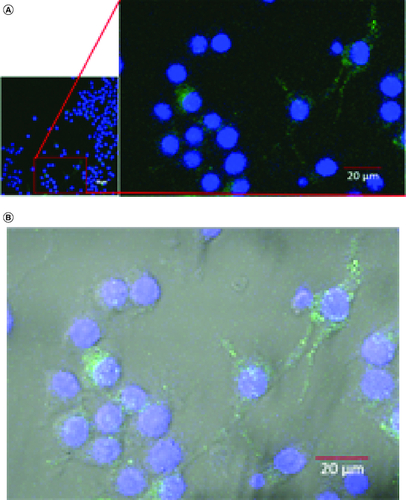
Figure 5. Percentage of RAW 264.7 viability after being treated with LPS in various concentrations.
Each treatment was compared with control, *p-value < 0.05; **p-value < 0.01; ***p-value < 0.001 (n = 3).
LPS: lipopolysaccharide.
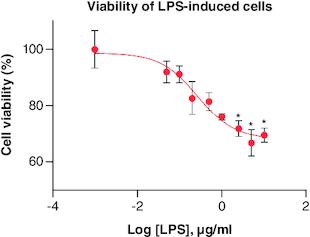
Figure 6. Total NO production from LPS-induced RAW 264.7.
Each treatment was compared with control and tested with ANOVA-Dunnett's test, *p-value < 0.05; **p-value < 0.01; ***p-value < 0.001 (n = 3).
ANOVA: Analysis of variance; LPS: Lipopolysaccharide; NO: Nitric oxide..
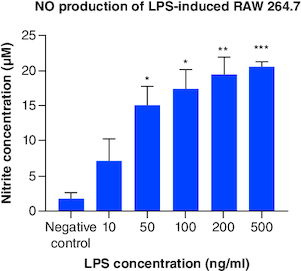
Figure 7. Total NO production from LPS-induced RAW 264.7 after being treated with various concentrations of GDEN.
Treatment with 40 μg/ml GDEN decreased NO production significantly compared with other GDEN concentrations. Each treatment was compared with every other treatment and tested with ANOVA-Dunnett's test.
*p-value <0.05; **p-value <0.01; ***p-value <0.001 (n = 3).
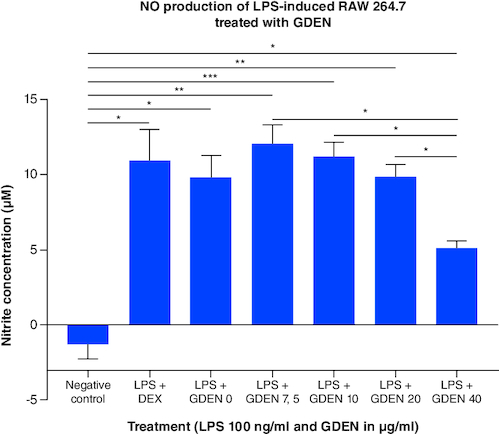
Figure 8. Expression of CD80 and CD209 after cells were induced by LPS and treated with various concentrations of GDEN.
CD markers expression was measured by flow cytometry. Statistical results showed that there was no significant difference between treatments, except LPS + GDEN 10 and LPS + DEX toward negative control.
*p-value <0.05 (n = 3).
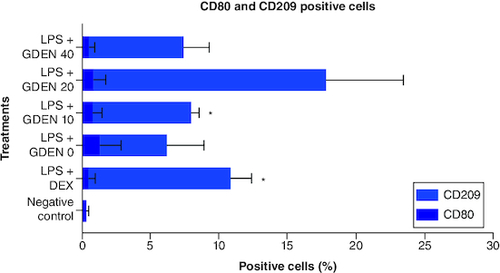
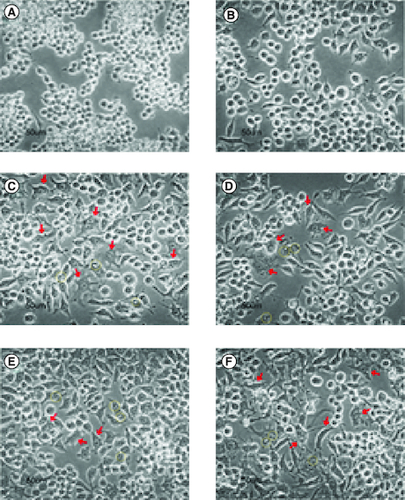
Figure 9. Cells morphology (400×).
From negative control (A), LPS + DEX (B), LPS + GDEN 0 μg/ml (C), LPS + GDEN 10 μg/ml (D), LPS + GDEN 20 μg/ml (E), and LPS + GDEN 40 μg/ml (F). Red arrow represented irregular-shaped cells with pseudopodia; yellow circle represented vacuolization in cell.