Figures & data
Table 1. Characteristics of the screening and validation sets.
Figure 1. Differentially expressed plasma miRNAs in the screening cohort.
(A) heatmap and (B) volcano plot demonstrating differentially expressed miRNAs between head and neck squamous cell carcinoma (HNSCC) patients and non-malignant controls (NCs). (C) Gene ontology analysis. (D) The top ten most significant KEGG pathways. (E) PPI network of potential target genes enriched in the top ten KEGG pathways. (F) The PPI network of hub genes originating from (E) with the most significant interactions. miRNAs with significant differential expression were defined as having a fold-change ≥2 and p < 0.05.
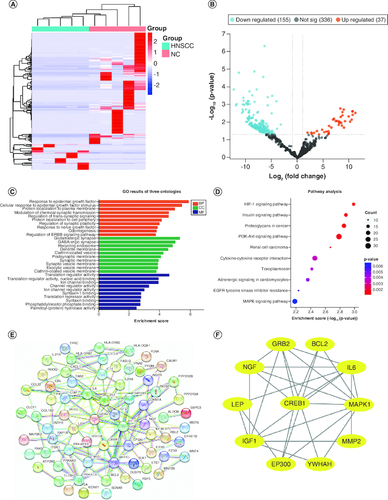
Figure 2. Plasma expression levels of miR-95-3p, miR-579-5p, and miR-1298-3p in the validation set.
The expression of (A) miR-95-3p, (B) miR-579-5p, and (C) miR-1298-3p in plasma was differentially expressed in HNSCC patients compared with NCs. The expression of (D) miR-95-3p, (E) miR-579-5p, and (F) miR-1298-3p in T1–T2 compared with T3–T4 disease. (G) miR-95-3p, (H) miR-579-5p, and (I) miR-1298-3p expression in stage I–II versus stage III–IV disease.
**p < 0.01; *p < 0.05.
ns: Not significant.
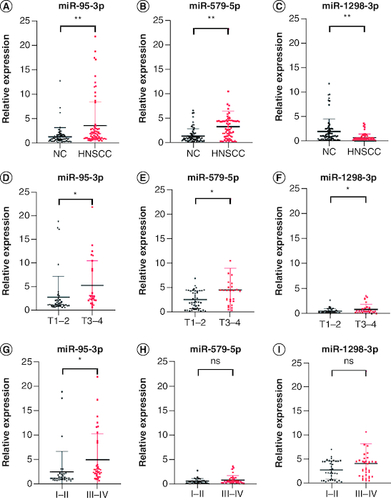
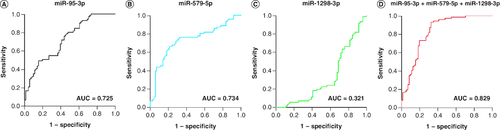
Figure 3. Receiver operating characteristics curve of miR-95-3p, miR-579-5p, miR-1298-3p and their combination to differentiate HNSCC patients from non-malignant controls.
(A) miR-95-3p. (B) miR-579-5p. (C) miR-1298-3p. (D) The combination of miR-95-3p, miR-579-5p and miR-1298-3p.