Figures & data
Figure 1. CRISPRa successfully reprograms human fibroblasts into iPSCs in a process that can be enhanced by small molecules.
(A) Depictions of previous attempts aiming to reprogram human fibroblasts into iPSCs using CRISPRa. O, OCT4; S, SOX2; M, MYC; L, LIN28; N, NANOG; K, KLF4; E, EEA motif. (B) RT-qPCR expression analysis of indicated pluripotency genes on days 0, 10 and 21 post-induction. Bars represent the mean and standard error of the mean. (C) Representative phase images (top left) and alkaline phosphatase staining (bottom left) of iPSC colonies emerging 6 days post-induction. Scale bars are 400 μm. Number of AP positive colonies (right) emerging using reprogramming medium with and without small molecules (SM) at 6 days post-induction (n = 3). (D) Expression analysis of pluripotency surface marker TRA-1-81 by flow cytometry in reprogramming cultures in iPSC media with and without small molecules (SMs) 6 days post-induction. (E) Phase contrast and immunofluorescence staining of iPSC colonies for pluripotency markers OCT4, SSEA-4, NANOG and TRA-1-81 28 days post-induction. Scale bars are 400 μm.
*p < 0.05.
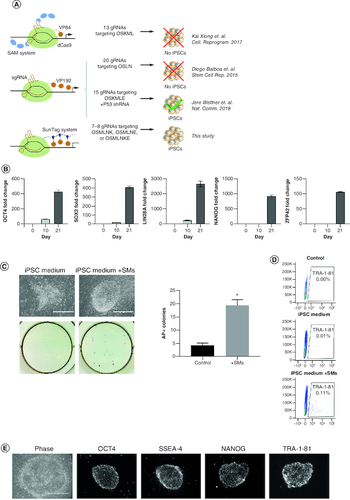
Figure 2. Generation of feeder-free single cell-derived naive-like CRISPRa iPSC lines.
(A) Schematic representation of reprogramming platform combining the SunTag CRISPRa system, optimized stage-specific naive iPSC media, and single-cell sorting by FACS. (B) Flow cytometry analyses of three reprogrammed cultures selected for single-cell cloning by sorting. Other conditions were not sorted as iPSC markers were not detected.
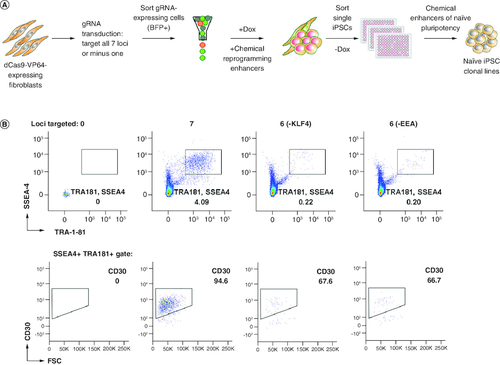
Figure 3. CRISPRa-SM iPSC clonal lines exhibit naive pluripotency and maintain genomic stability.
(A) Flow cytometric analysis of CRISPRa iPSC clones for pluripotency surface markers SSEA-4, TRA-1-81 and CD30. Control iPSCs were generated using plasmid-based reprogramming methods. (B) Immunofluorescence staining for pluripotency markers NANOG, SSEA-4, OCT4, and TRA-1-81. Scale bars are 100 μm. (C) G-banded karyotype analysis of CRISPRa-derived iPSC clones. (D & E) Gene expression analysis by RNA-seq. Principal component analysis of parental fibroblasts and derived iPSC lines generated using various reprogramming methods (CRISPRa, episomal vectors (Epi), Sendai viruses (SVs) and transient plasmid-based (TP). (D) Heat map depicting expression of naive (bracket), primed (starred) and shared pluripotency genes in parental fibroblasts and derived iPSC lines generated using indicated reprogramming methods. (E) All iPSC lines were generated in naive iPSC medium except for the indicated control iPSC line which was maintained in primed iPSC medium (E8 medium, Prim).
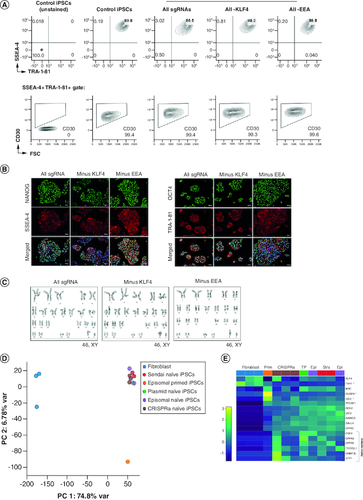
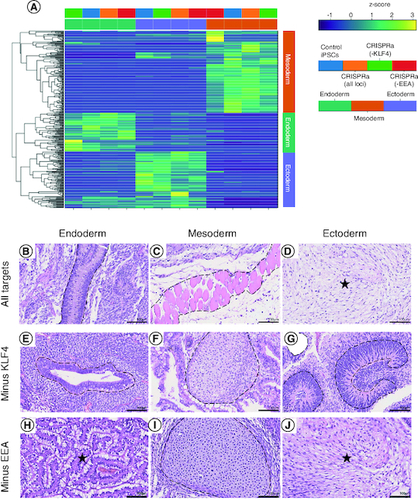
Figure 4. CRISPRa-SM iPSC lines have a similar pluripotent potential to that of conventional iPSCs.
(A) In vitro tri-lineage differentiation of CRISPRa-generated and plasmid-generated (control) iPSC lines analyzed by RNA-seq show successful differentiation into the three germ layers. (B–J) Histological analysis of tissue sections of CRISPRa iPSC-derived teratomas harvested at 6–8 weeks; hematoxylin and eosin staining. Representative endodermal, mesodermal and ectodermal tissues present in excised and sectioned teratoma. (B) Columnar epithelium. (C) skeletal muscle. (D) Neuroepithelium. (E) Ductal structure; columnar epithelium. (F) Cartilage. (G) Neuroepithelium. (H) Gastroinstestinal mucus-secreting columnar epithelium. (I) Cartilage. (J) Neural tissue. Scale bars are 100 μm.