
Figures & data
Figure 1. Study flow diagram.
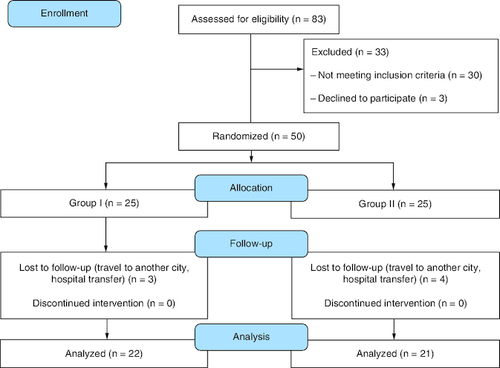
Table 1. Comparison of the baseline characteristics for the drug and placebo groups.
Table 2. Comparison of serum concentration of the study biomarkers for both drug and placebo groups.
Figure 2. Comparison of sVCAM-1 level between group I and group II at baseline and at the end of the study.
Group I (n = 22): patients received 400 mg tablet of PTX thrice daily in addition to their standard treatment for 2 months. Group II (n = 21): patients received placebo tablets in addition to their standard treatment for 2 months. The p-value of end of study level of sVCAM-1 in group I versus group II = 1.00.
n: Number; PTX: Pentoxifylline; sVCAM-1: Soluble vascular cell adhesion molecule-1.
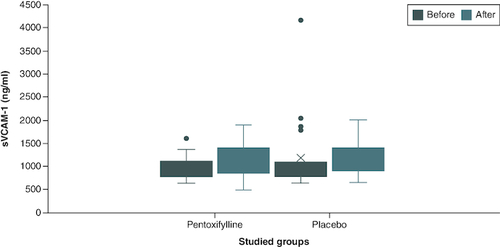
Table 3. Comparison of efficacy and safety between the pentoxifylline and the placebo groups.