Figures & data
Figure 1 (A) Original image and (B) unsupervised segmentation using our algorithm. The arrows mark the isolated lesions.
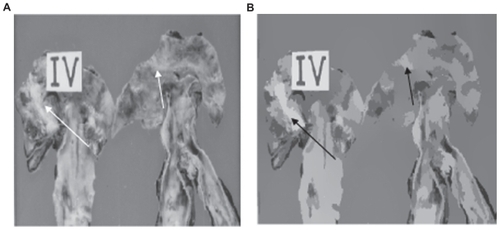
Figure 2 (A) Original image and (B) segmentation using our unsupervised strategy. The arrows indicate isolated lesions. The split arrow indicates a zone which is not a lesion.
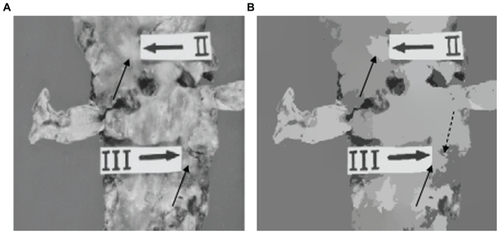
Figure 3 (A) Original image. (B) Segmentation by using our unsupervised strategy. The arrows indicate the isolated lesions. Note the quality of segmentation of the Type lesion in (B).
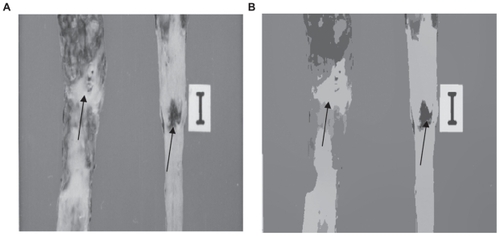
Figure 4 (A) Original image and (B) segmentation using our unsupervised strategy. The arrows indicate the isolated lesions. The split arrows indicate zones which are not lesions.
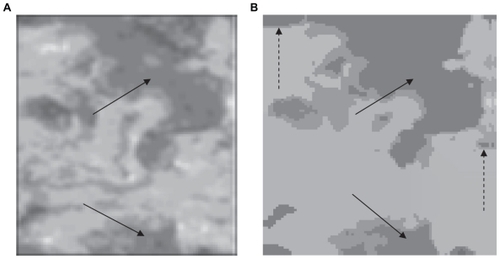
Figure 5 (A) Original image and (B) segmentation using our unsupervised strategy. The arrow indicates the isolated lesion.
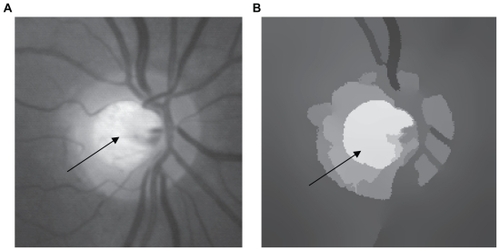
Table 1 Numerical results of the validation