
Figures & data
Figure 1 Schematic overview of the computer-aided drug design approach used in the identification of HsPEPCK-M potential inhibitors.
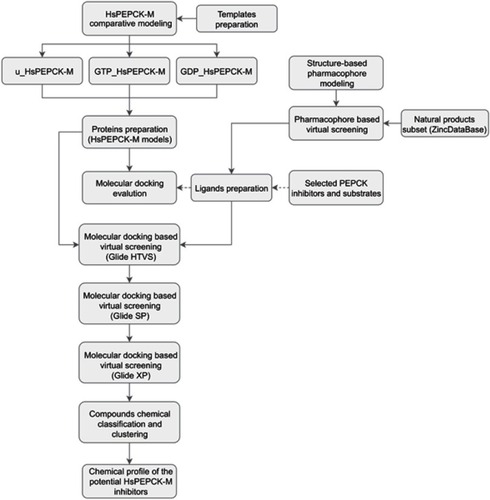
Figure 2 Set of PEPCK substrates (1–2), PEPCK-C inhibitors (3–9), and PEPCK-M inhibitor (10) used in the docking study. The molecular weight is in g/mol.
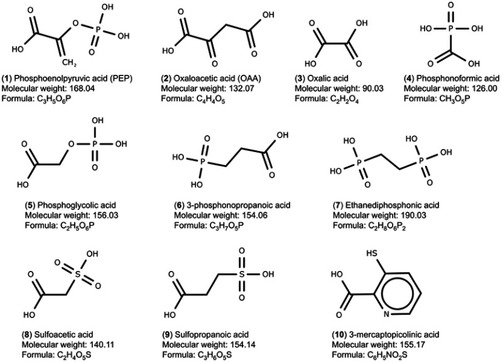
Figure 3 The three-dimensional structures of HsPEPCK-M models and the templates. (A) The structural superposition of GTP_HsPEPCK-M (green), the prepared template HsPEPCK-C with GTP (PDB ID 1KHE – grey) and GgPEPCK-M (PDB ID 2FAH – pink). The active site poses of (B) the model GTP_HsPEPCK-M complexed with GTP and OAA (C) GDP_HsPEPCK-M complexed with GDP and PEP and (D) u_HsPEPCK-M without ligands. All ligands are represented as ball and sticks, and residues’ sidechains are represented as sticks. The two manganese ions are represented as purple spheres. Protein structural figures were generated using Pymol 2.1.0.
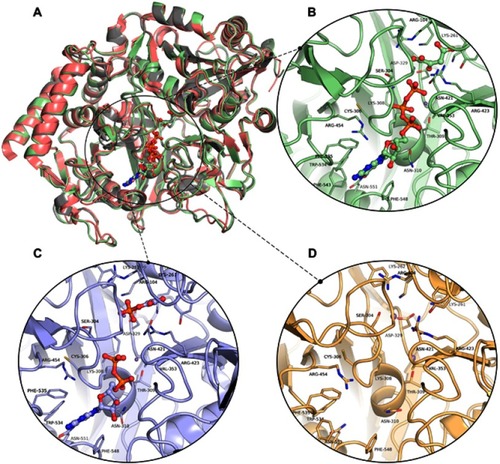
Figure 4 Structure-based pharmacophore hypothesis (PH). Important pharmacophoric features in the active site of HsPEPCK-C in the 1KHF structure are represented in (A) PH1 and (B) PH2. In the insets are the schematic representations of PH1 and PH2 with the distances between features in angstroms (Å). Pharmacophore features are colored according to their characteristic: red=negative ionic, blue=positive ionic, yellow=H-bond acceptor and white=H-bond donor.
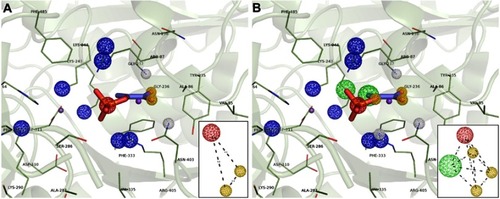
Table 1 Area under the curve and enrichment factors for decoy dockings
Table 2 Docking Scores of the positive controls and the ten best scoring compounds for HsPEPCK-M in all configurations
Figure 5 Chemical classification and distribution of compounds on classes based on ClassyFire software. (A) Chemical classes of the HsPEPCK-M potential inhibitors. (B) Chemical superclasses of the HsPEPCK-M potential inhibitors. (C) The chemical superclasses and distribution of the compounds on 13 clusters obtained in the clusterization procedure.
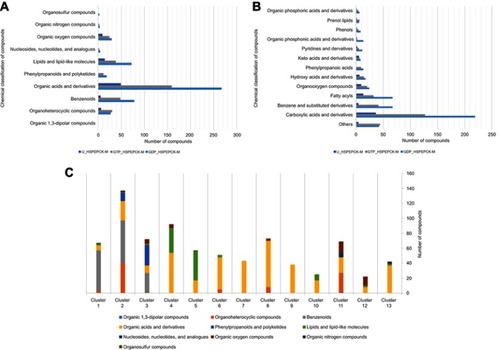
Figure 6 Heat map and dendrogram for the clusters of the 779 potential HsPEPCK-M inhibitors. The selected cut-off point generated 13 groups – an illustrative chemical structure is presented for each cluster (1–13). The heat map represents the docking score for (A) GTP_HsPEPCK-M, (B) GDP_HsPEPCK-M and (C) u_HsPEPCK-M. The best scores are depicted in dark blue while the worst are in light green.
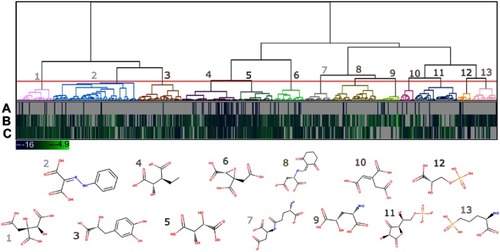
Figure 7 Binding mode of the hydroxycitrate (ZINC01656421) and tartaric acid (ZINC895296) in GTP_HsPEPCK-M active site obtained with the molecular docking assay. (A) and (C) are the 3D binding modes of hydroxycitrate and tartaric acid, respectively. The inhibitors are represented as ball and sticks, the protein represented in light green, and the intermolecular interactions are represented as gray dashes; (B) and (D) are the 2D interactions diagram of molecular docking results of hydroxycitrate and tartaric acid, respectively. The 2D residues are illustrated as negatively charged (red), positively charged (purple), polar (blue), hydrophobic (green). The hydrogen bonds are represented as purple arrows and salt bridges are represented as blue/red lines. The 3D and 2D images were generated using Pymol 2.1.0 and Maestro, respectively.
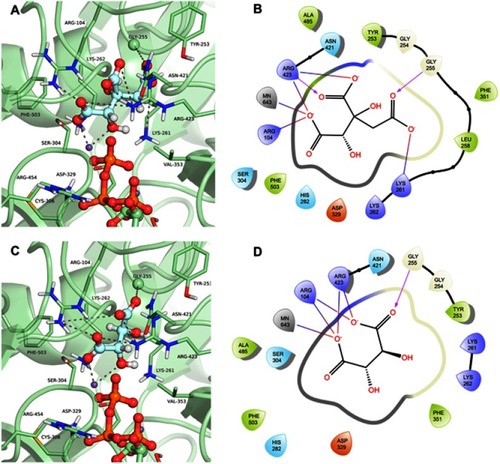
Figure 8 Binding mode of the danshensu (ZINC00895535) and 2-(2-Phenylhydrazono)malonic acid (ZINC02571340) in GDP_HsPEPCK-M and u_HsPEPCK-M active site, respectively, obtained with the molecular docking assay. (A) and (C) are the 3D binding modes of danshensu and 2-(2-Phenylhydrazono)malonic acid, respectively. The inhibitors are represented as ball and sticks, the protein represented in light purple (GDP_HsPEPCK-M) and light orange (u_HsPEPCK-M), and the intermolecular interactions are represented as gray dashes; (B) and (D) are the 2D interactions diagram of molecular docking results of danshensu and 2-(2-Phenylhydrazono)malonic acid, respectively. The 2D residues are illustrated as negatively charged (red), positively charged (purple), polar (blue), hydrophobic (green). The hydrogen bonds are represented as purple arrows and salt bridges are represented as blue/red lines. The 3D and 2D images were generated using Pymol 2.1.0 and Maestro, respectively.
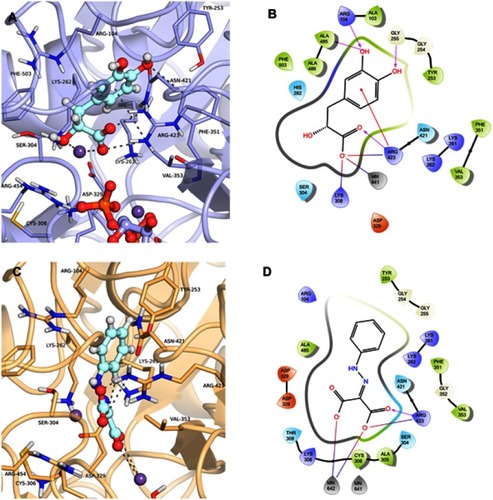
Table 3 ADME properties, PAINS filters for PEPCK known inhibitors and selected putative HsPEPCK-M inhibitors