Figures & data
Table 1 Summary of Top Five Hits Screened Against SARS-CoV-2 Mpro
Figure 1 3D and 2D representation of the best docked pose of the compound 3-octane highlighting the critical binding site residues of Mpro. (A) Ribbon representation of the ligand 3-octane bound to the Mpro. The blue color represents the ribbon representation of Mpro while the ligand is represented in green color. The protein residues interacting with the ligand are represented in orange color. (B) The surface representations of the Mpro depicting the ligand are tightly bound within the binding groove of the protein. (C) The 2D representation of the docked pose protein–ligand complex. (i) 2D interaction diagram of 3-octane–Mpro complex generated by MOE. (ii) Ligplot representation of the protein–ligand complex drawn by LigPlot+. (iii) 2D depiction of the docked complex highlighting hydrogen bonds and cation-p interaction through DS Visualizer.
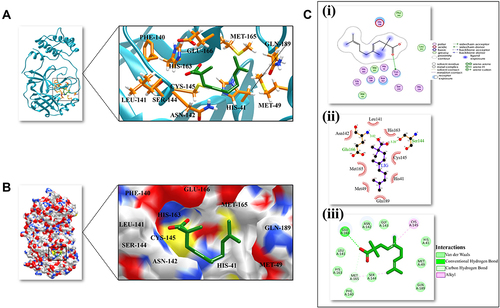
Figure 2 Global stability analysis of ligand-hACE2 protein complexes throughout 200 ns all-atom MD simulation. (A) Analysis of RMSD trajectories for the 3-octane–Mpro protein complex throughout 200 ns MD simulation deciphering the primary conformational switches. (B) The radius of gyration for the protein–ligand complex reflects the complex structure’s global stability. (C) RMSF of protein–ligand complex depicting fluctuations across protein residues during 200 ns of MD simulations. (D) Extent of Mpro binding site coverage via SASA analysis along with the time evolution 200 ns all-atom MD simulation.
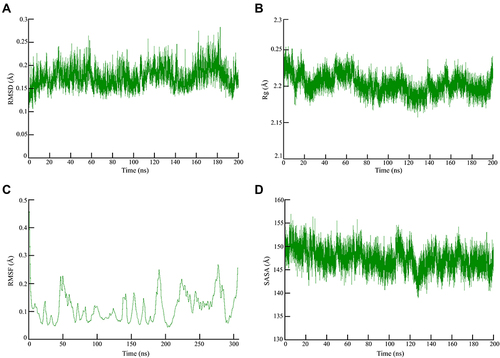
Figure 3 The structure superimposition of MD trajectories (0 ns, 50 ns, 100 ns, 150 ns, and 200 ns) over the pre-simulated 3-octane–Mpro complex. (A) The secondary structure representation of superimposed protein–ligand complexes. The ligand is represented in green color. (B) The surface representation of Mpro representing that ligand is bound within the same active site groove throughout the 200 ns of MD simulation run considering it stable active site conformation of the ligand.
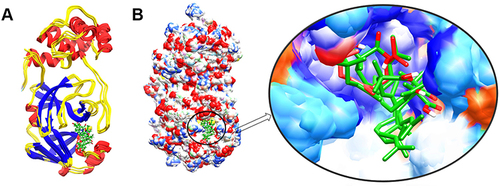
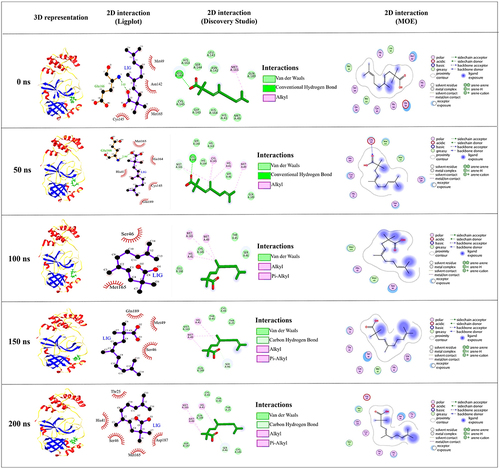
Figure 4 Conformations of the 3-octane complex at Mpro binding site through selected trajectories.