
Figures & data
Figure 1 Visualization of advantages of combination chemotherapy.
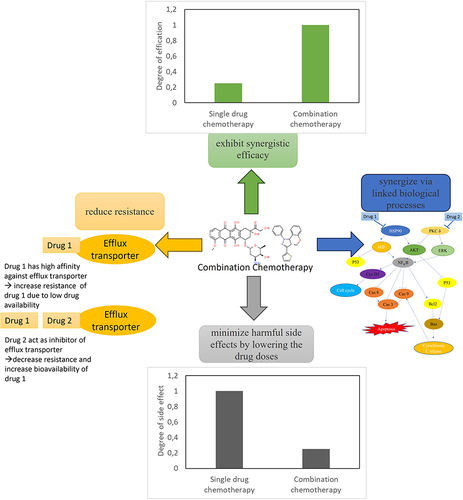
Table 1 Adverse Effect of Doxorubicin + Cyclophosphamide Combination. Probability Range: 0–1
Table 2 Adverse Effect of Doxorubicin + Pyrazoline B Combination. Probability Range: 0–1
Table 3 Overlapping of P450 Activities of Doxorubicin, Cyclophosphamide, Pyrazoline B. Probability Range: 0–1
Table 4 Adverse Effect of Paclitaxel + Ascorbic Acid Combination. Probability Range: 0–1
Table 5 Adverse Effect of Paclitaxel + Pyrazoline B Combination. Probability Range: 0–1
Table 6 Overlapping of P450 Activities of Paclitaxel, Ascorbic Acid, Pyrazoline B. Probability Range: 0–1
Table 7 Binding Affinity of Pyrazoline B and Doxorubicin Against Target of Doxorubicin (Topoisomerase I and II)
Figure 2 Protein-ligand docking and macromolecular docking of topoisomerase I. (A) The binding of topoisomerase I and pyrazoline B (green) or doxorubicin (red). (B) The binding of topoisomerase I and cyclophosphamide (cyan) or doxorubicin (red). (C) Pyrazoline B-topoisomerase I interaction. (D) Cyclophosphamide-topoisomerase I interaction. (E) Doxorubicin-topoisomerase I interaction. (F) Topoisomerase I without ligand. (G) Topoisomerase I-doxorubicin. (H) Topoisomerase I-pyrazoline B. (I) Topoisomerase I-Doxorubicin-pyrazoline B. (J) Topoisomerase I cyclophosphamide. (K) Topoisomerase I-doxorubicin-cyclophosphamide.
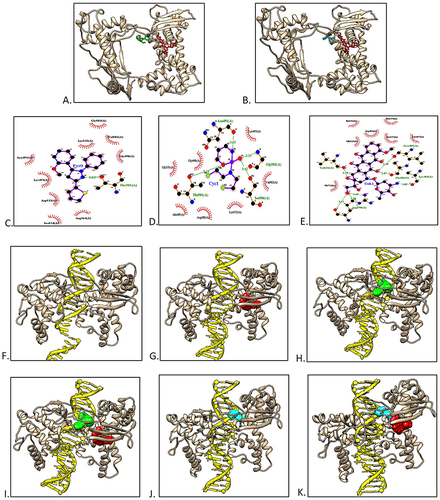
Table 8 Results of Topoisomerase I-DNA Chain Docking
Table 9 Results of Topoisomerase II-DNA Chain Docking
Figure 3 Docking of topoisomerase II and ligands. (A) The binding of topoisomerase II and pyrazoline B (green) or doxorubicin (red). (B) The binding of topoisomerase II and cyclophosphamide (cyan) or doxorubicin (red). (C) Pyrazoline-topoisomerase II interaction. (D) Cyclophosphamide-topoisomerase II interaction. (E) Doxorubicin-topoisomerase II interaction.
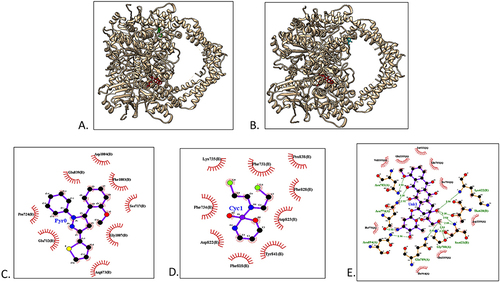
Table 10 Binding Affinity of Pyrazoline B and Paclitaxel Against Target of Paclitaxel (α-β Tubulin and Bcl2)
Figure 4 Protein-ligand docking and macromolecular docking of α tubulin. (A) Pyrazoline B (green) and Paclitaxel (Orange) binding to α-β tubulin. (B) Ascorbic acid (blue) and Paclitaxel (Orange) binding to α-β tubulin. (C) α-β tubulin-pyrazoline B. (D) α-β tubulin-ascorbic acid. (E) α- β tubulin-paclitaxel. (F) α-tubulin without ligand. (G) α tubulin-Paclitaxel. (H) α tubulin-pyrazoline B. (I) α tubulin-Paclitaxel-pyrazoline B. (J) α tubulin-ascorbic acid. (K) α tubulin-Paclitaxel-ascorbic acid.
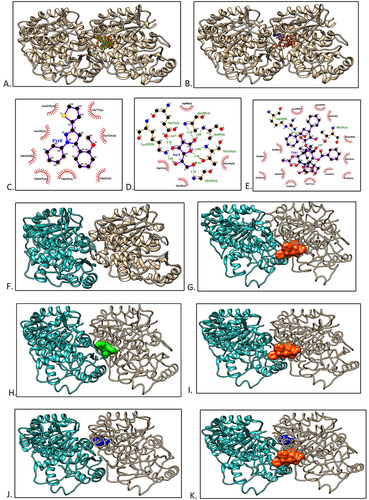
Table 11 Macromolecules Docking of α and β Tubulin
Figure 5 Protein-ligand docking and macromolecular docking of Bcl2. (A) Pyrazoline B (green) and Paclitaxel (Orange) binding to Bcl2. (B) Ascorbic acid (blue) and Paclitaxel (Orange) binding to Bcl2. (C) Pyrazoline B interaction with residues on Bcl2. (D) Ascorbic acid interaction with residues on Bcl2. (E) Paclitaxel interaction with residues on Bcl2. (F) Bcl2 without ligand. (G) Bcl2-Paclitaxel. (H) Bcl2-pyrazoline B. (I) Bcl2-Paclitaxel-pyrazoline B. (J) Bcl2-ascorbic acid. (K) Bcl2-Paclitaxel-ascorbic acid.
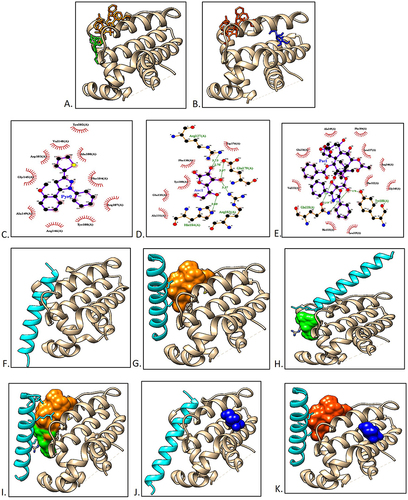
Table 12 Macromolecules Docking of Bcl2 and Bax