Figures & data
Table 1 Descriptive and statistical overview of dimensions of parenting styles, separated by groups (athletes vs controls) and by gender (females vs males)
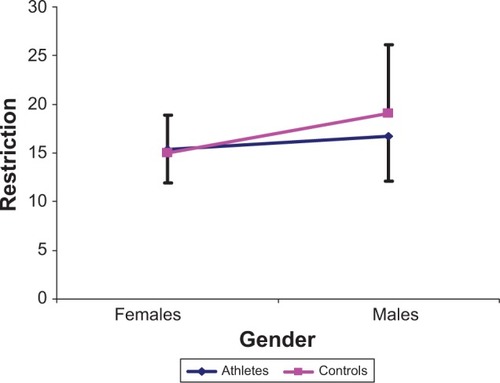
Figure 1 The degree of restriction differs significantly between athletes and controls (factor group: F(1, 413) = 4.66, P < 0.05), with an increased restriction for controls, and between female and male participants (factor gender: F(1, 413) = 31.92, P < 0.001), with an increased restriction for males. The significant group by gender interaction (F(1, 413) = 8.41, P < 0.01) reflects highest (“worst”) scores for male controls. The graph shows means and standard deviations (error bars).