
Figures & data
Figure 1 Timeline of the study.
Abbreviations: GMFCS, gross motor function classification system; ROM, range of motion.
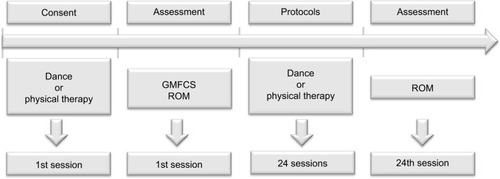
Figure 2 Flow diagram of the study.
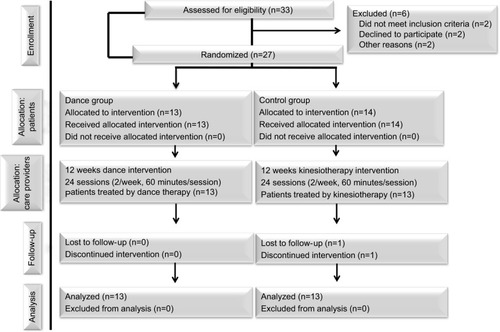
Table 1 Descriptive and anthropometric characteristics of participants at baseline
Table 2 Participants’ passive lower limbs range of motion, pretreatment, and posttreatment in both groups, control and dance