
Figures & data
Table 1 Distribution of Adolescent Mothers by Study Variables
Table 2 Distribution of Adolescent Mothers by ANC Attendance, Provider, Providing Facility, Number of ANC Visits and Components of Care Received
Figure 1 Percentage of all adolescent mothers who attended ANC by number of components of care received during ANC visits.
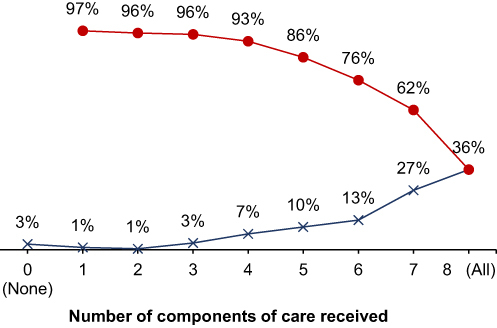
Figure 2 Percentage of adolescent mothers who made the first ANC visit in the first trimester by number of components of care received during ANC visits.
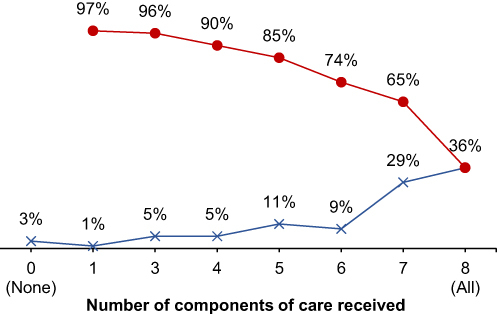
Table 3 Factors Associated with Quality of ANC and Timing of the First ANC Visit
Table 4 Logistic Regression Analysis Results of Determinants of Receipt of Good Quality ANC
Table 5 Logistic Regression Analysis Results of Determinants of Timing of the First ANC Visit