Figures & data
Table 1 Characteristics of women who were behaviorally or perinatally infected with human immunodeficiency virus
Figure 1 Viral load across time points in women behaviorally and perinatally infected with the human immunodeficiency virus.
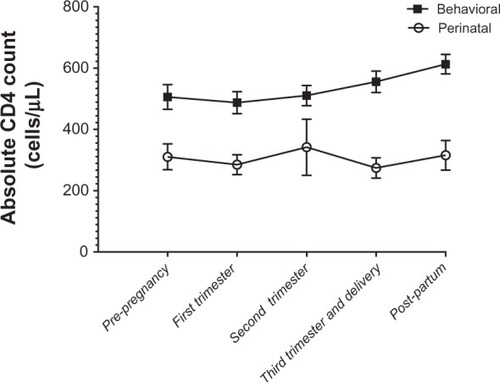
Figure 2 CD4 counts across time points in women behaviorally and perinatally infected with the human immunodeficiency virus.
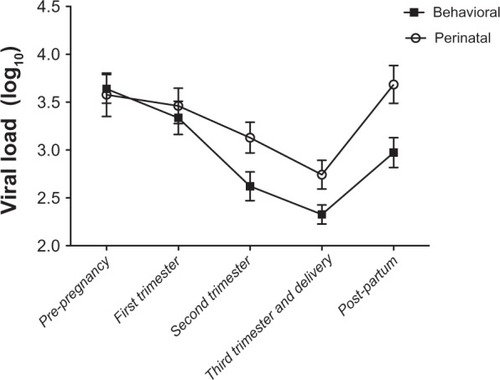
Table 2 CD4 and viral load comparisons between women who were behaviorally or perinatally infected with human immunodeficiency virus
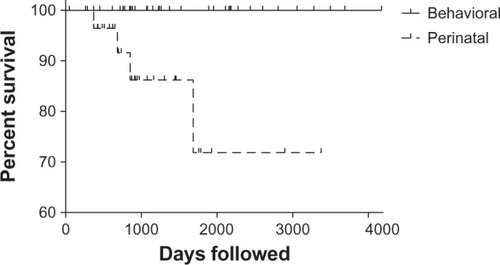
Figure 3 Simple survival curve with censored subjects denoted.
Notes: The 35 behaviorally infected women were followed for an average of 1663 (range 47–4173) days and the 30 perinatally infected women were followed for an average of 1069 (range 263–3378) days. There were four deaths in the perinatal group at 369, 684, 853, and 1685 days from their pregnancies.