
Figures & data
Figure 1 Flow diagram showing recruitment of study participants.
Abbreviations: IDI, Infectious Diseases Institute; TC-IDI, Transition Clinic at Infectious Diseases Institute.
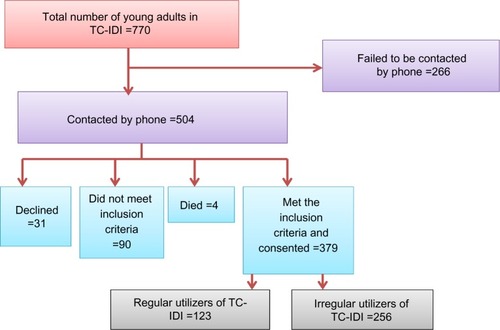
Table 1 Demographic and clinical characteristics of YALHA attending the HTC
Figure 2 Graph showing HTC services utilized by YALHA in the 6 months prior to the study.
Abbreviations: AIDS, acquired immunodeficiency syndrome; HIV, human immunodeficiency virus; HTC, HIV transition clinic; YALHA, young adults living with HIV/AIDS.
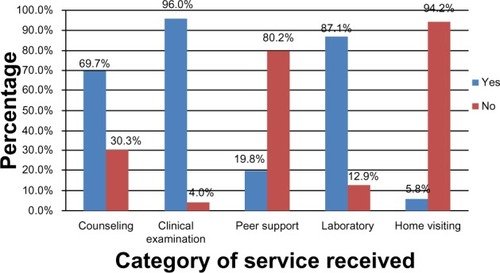
Table 2 Relationships between YALHA demographic and clinical characteristics with HTC utilization
Table 3 Community determinants of HTC utilization by YALHA
Table 4 Health services delivery factors associated with HTC utilization by YALHA
Table 5 Determinants of HTC utilization by YALHA