
Figures & data
Table 1 Reliability test of questionnaire
Table 2 Pearson correlations between scales and subscales of the Revised Two-factor Study Process Questionnaire
Figure 1 Mean ± standard deviation of deep and surface study approach including their motive and strategy among all participants.
Note: These are mean scores out of a possible score of 50 for deep and surface approach and out of a possible score of 25 for motive and strategy subscales.
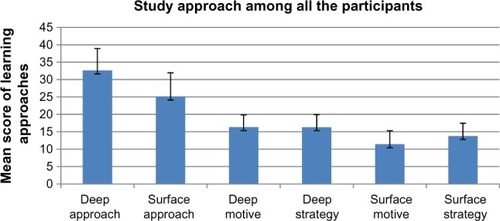
Table 3 Comparison of the R-SPQ-2F measures between MBBS, BDS, and nursing students on study approach
Table 4 Comparison of study approach between first- and second-year medical and dental students
Table 5 Multiple comparisons (ANOVA) between MBBS, BDS, and nursing students to explore the differences in mean score of different study approach