Figures & data
Table 1 Search terms used in Medline, Embase, and Scopus
Figure 1 Overview of the article-selection process.
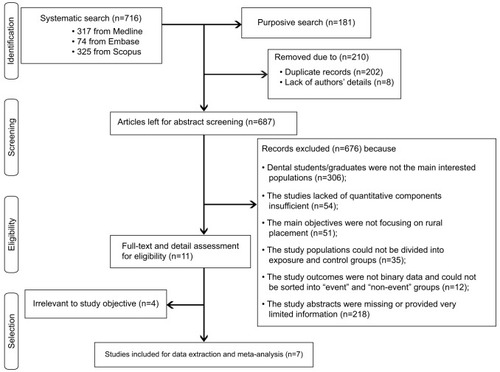
Table 2 Data-extraction table presenting key characteristics of each study
Table 3 Potential biases and methodological limitations in each study
Figure 2 Meta-analysis of all seven studies with random-effect model, showing results in terms of OR.
Abbreviations: OR, odds ratio; CI confidence interval.
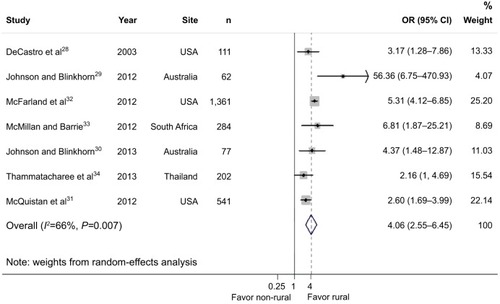
Table 4 Number of “exposure” and “control” participants in each study
Figure 3 Meta-analysis of all seven studies with random-effect model, showing results in terms of RR.
Note: A P-value of 0.000 is a P-value of less than 0.001 due to the standard STATA output.
Abbreviations: RR, risk ratio; CI confidence interval.
Abbreviations: RR, risk ratio; CI confidence interval.
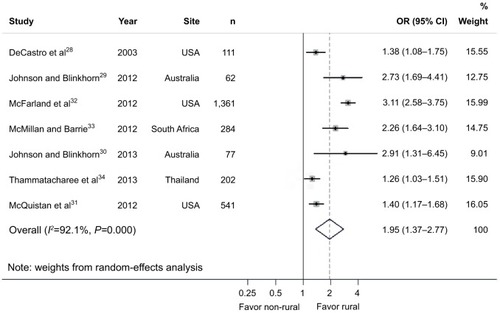
Figure 4 Subgroup meta-analysis between rural background and rural clinical rotation.
Abbreviations: OR, odds ratio; CI confidence interval.
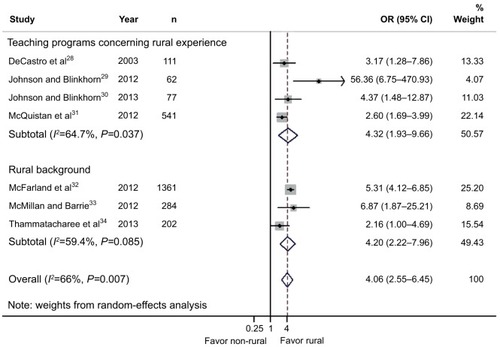
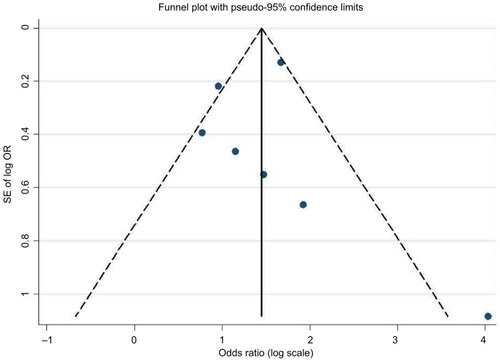
Figure 5 Funnel plot of the seven studies.
Abbreviations: SE, standard error; CI confidence interval.