
Figures & data
Table 6 Themes identified in medical students’ comments during semi-structured interview, with illustrative quotations
Table 1 Distribution of the respondents by sex and age (N=47)
Figure 1 Prevalence of “toxic” phenomenon among the respondents.
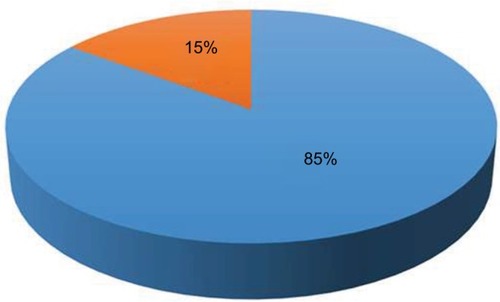
Table 2 Frequency of “toxic” experiences among students and their disclosure pattern
Figure 2 Level of satisfaction of “toxic” victims with the outcome of their disclosure after disclosing.
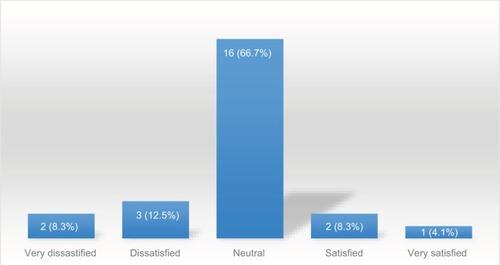
Table3 Pattern of “toxic” disclosure among respondents by sex
Table 4 Distribution of respondents by their reason for not discussing their “toxic” experience by sex
Table 5 Perception of respondents on the adverse effects of public belittlement on students