
Figures & data
Table 1 Comparison between the two groups of the study population: “female students” and “male students”
Figure 1 Histograms showing the distribution of Epworth Sleepiness Scale and PSQI Score in the study population.
Abbreviation: PSQI, Pittsburgh Sleep Quality Index.
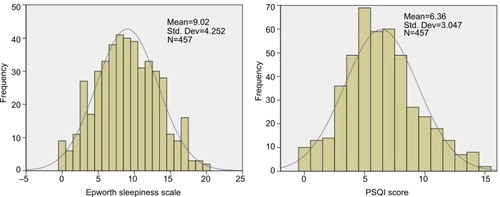
Table 2 Comparison between the two groups of the study population: “students in first or second medical year” and “students from the third to the fifth medical year”
Table 3 Univariate linear regression model for factors associated with the academic performance of the study population
Table 4 Multiple linear regression analysis showing adjusted factors of academic performance among the study population