
Figures & data
Table 1 Mean scores (over 100) at session 1 and session 2 of passing LASTT test
Figure 1 Distribution of evolution ratio of all participants.
Note: In black (horizontal black line) the mean score for every group or sub-group.
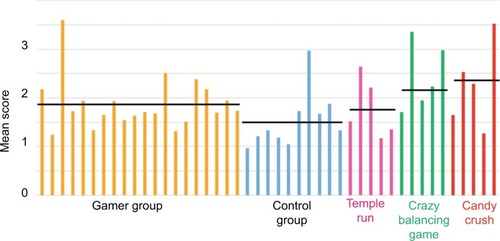
Table 2 Mean evolution ratio for every group and sub-group
Table 3 Mean evolution ratio for the intervention group and every exercise relative to this group