
Figures & data
Table 1 Mapping of the ophthalmology and ENT courses within the curriculum
Figure 1 Student SDL and PBL scores for both the ophthalmology and ENT courses.
Abbreviations: ENT, ear nose and throat; Ophth, ophthalmology; PBL, problem-based learning; SDL, self-directed learning.
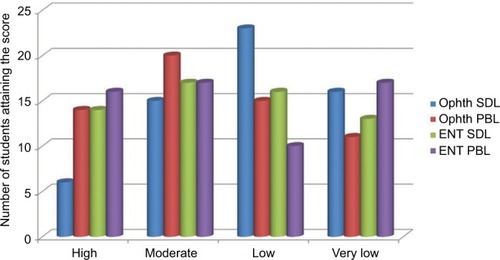
Table 2 Number and percentages of each group for SDL and PBL for both ophthalmology and ENT courses with statistical analysis by independent t-test
Table 3 Distribution of students according to their grades in SDL and PBL based on their total score in the ophthalmology course