
Figures & data
Table 1 Stages of MRP
Table 2 Demographic characteristics and baseline USMLE test scores
Figure 1 Percentage of right answers (residents 1, 2, 3, and 4) in simulated timed multiple-choice tests.
Note: Tests 1, 2, and 3 included 25 questions and tests 4 and 5 had 50 questions.
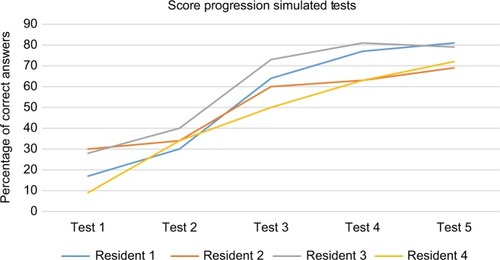
Figure 2 Resident comfort level scale (1–10) measured halfway through remediation program and at the end.
Note: 1, fully uncomfortable; 10, completely comfortable.
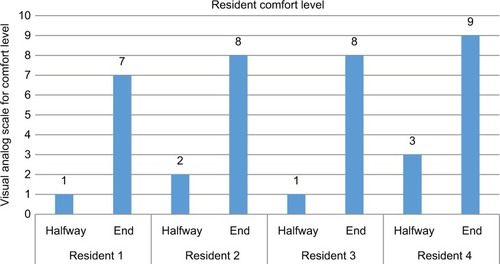
Table 3 ABA basic examination and ITE scores