Figures & data
Figure 1 ADDAPT teaching steps.
Abbreviation: ADDAPT, Assess & Aware, Demonstrate, Decode, Act & Accomplish, Perform, Teach & Test.
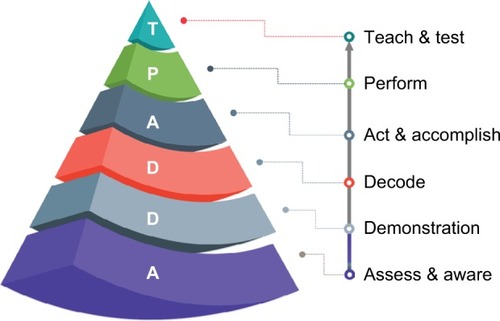
Figure 2 Students engagement in the small group where the table demonstrator is explaining the steps of the procedure.

Table 1 ADDAPT rating scale
Figure 3 MCQ pre- and posttest score.
Abbreviation: MCQ, multiple choice question.
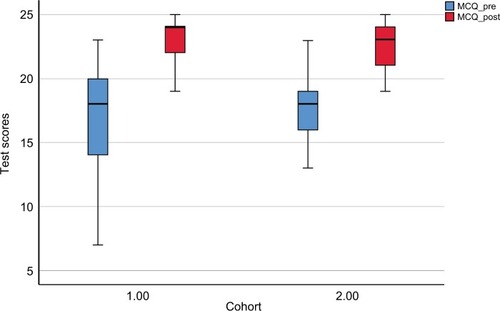
Figure 4 OSPE pre- and posttest score.
Abbreviation: OSPE, objective structured practical examination.
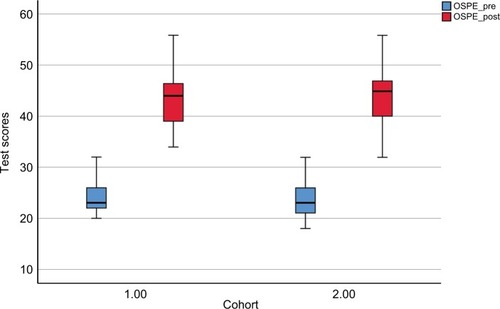
Table 2 Paired-samples statistics
Table 3 Paired-samples test
Table 4 Reliability statistics among independent expert raters
Table 5 Reliability statistics among table demonstrators
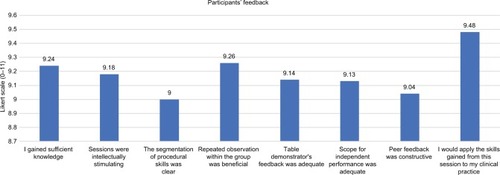
Figure 5 Participants’ qualitative feedback.