
Figures & data
Figure 1 Distribution of scores by learning styles.
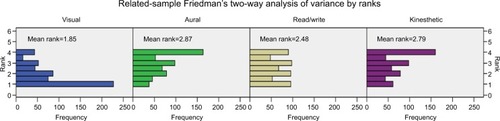
Table 1 Descriptive statistics for VARK score (n=545)
Table 2 Friedman’s test, post hoc pairwise comparison among learning styles
Table 3 Distribution of VARK scores by response type
Table 4 Gender wise comparison of learning styles