Figures & data
Table 1 Faculty of Medicine and Health Sciences 6-year curriculum structure indicating units, modules, clerkships, course averages, and examinations in chronological order
Table 2 Predictability (percent) of various preadmission criteria and selected program grades (darker background indicates higher predictability)
Figure 1 Profile of above average (top 20th percentile), average (middle 60th percentile,) and below average (bottom 20th percentile) grades for students for whom all scores were available from the high school grade to the final integrated examination (n = 297).
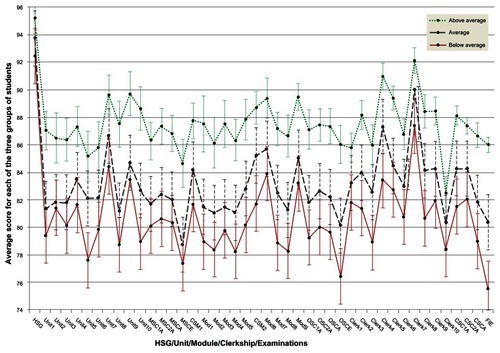
Figure 2 Predictability of preadmission grades and all medical school grades for the final integrated examination.
Abbreviations: The abbreviations used in this figure are shown in .
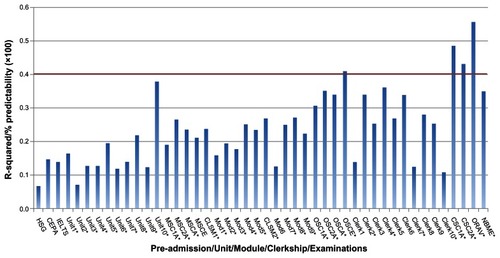
Figure 3 Predictability of year averages and course examinations for the final integrated examination.
Abbreviations: The abbreviations used in this figure are shown in .
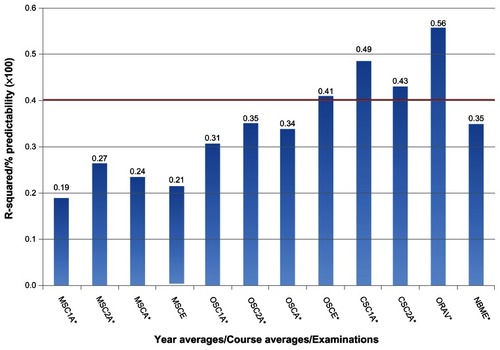
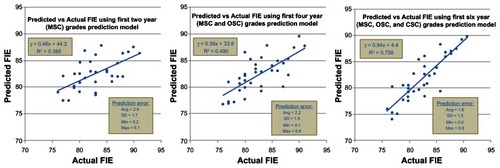
Figure 4 Regression analysis model: Predicted versus actual final integrated examination grade using 2009–2010 grades.