
Figures & data

Table 1 Frequency distribution of variables defining the study population
Table 2 Study-population variables
Table 3 Preferred mode of learning and their subcategories among preclinical medical students
Figure 1 Distribution of students’ preferred modes of learning by age and academic performance.
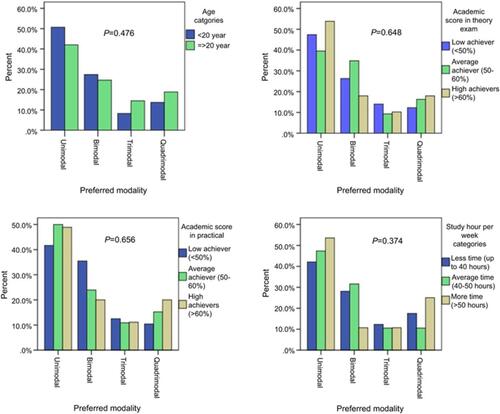
Figure 2 Distribution of students' preferred modes of learning by sex, faculty, and nationality.
Abbreviations: MBBS, Bachelor of Medicine–Bachelor of Surgery; BDS, Bachelor of Dental Surgery.
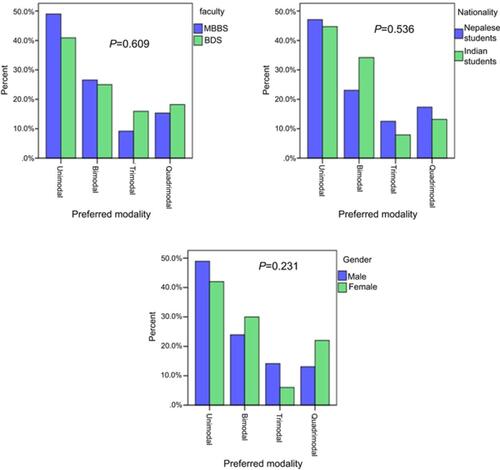
Table 4 Association between VARK learning preferences and characteristics of participants
Table 5 Association between VARK learning preferences with age and academic performance of the participants
Figure 3 Box-and-whisker plots showing the relationship between categorical variable (learning styles) and scale variables (academic performance).
Note: Outliers shown as circles and extreme outliers as asterisks.
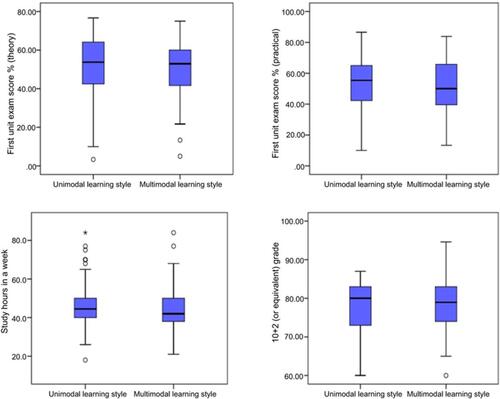
Table 6 Tests for normality for all quantitative variables
Table 7 Comparison of quantitative variables between unimodal and multimodal learners (independent-sample t-test and Mann–Whitney U test)
Table 8 Individual and total VARK scores based on sex
Table 9 Bivariate correlation coefficient between different VARK scores and academic performance of the students. Test used- Spearman correlation test
Table 10 Comparison of present study with previous studies. Most common learning modes are presented within brackets