Figures & data
Table 1 Demographic Information Of Participants
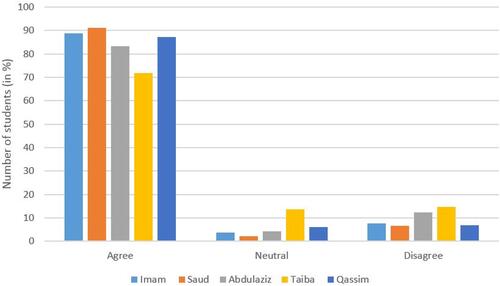
Figure 1 Perception of students from different universities in Saudi Arabia regarding peer assessment.
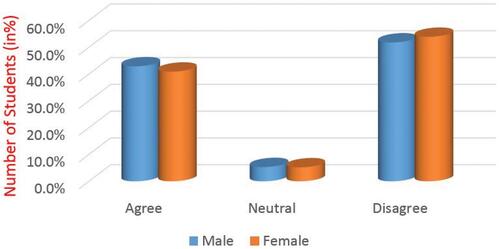
Figure 2 Perception of students from different universities in Saudi Arabia regarding students’ involvement in the school’s accreditation process.
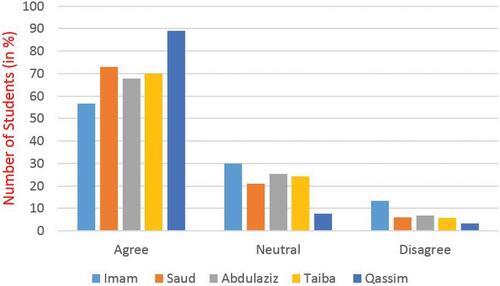
Figure 3 Perception of students from different universities in Saudi Arabia regarding students’ participation as active learner with responsibility for their own learning.
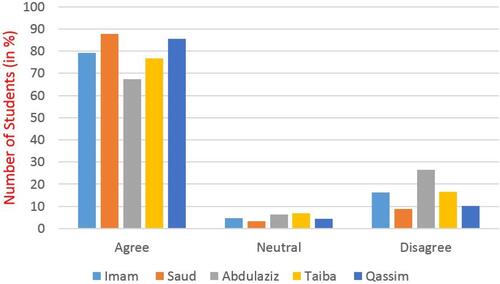
Figure 4 Students’ perception regarding their participation as active learners with responsibility for their own learning in relation to their GPA.
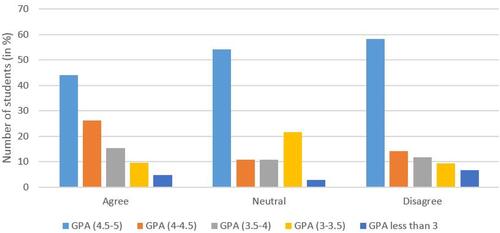
Figure 5 Perception of students from different universities in Saudi Arabia regarding students’ involvement, formally and informally, in peer teaching.
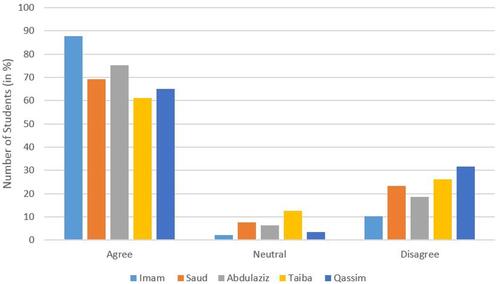
Figure 6 Perception of students from different universities in Saudi Arabia regarding students’ engagement with arranged extracurricular activities.