
Figures & data
Table 1 Comparison of Baseline Characteristics in the Studied Groups
Table 2 Comparison of the Number of Correct Responses in the Interpretation of ECG Terraces in the Studied Groups
Figure 1 Comparison of the frequency of correct responses to the difficulty level of terraces in the first group.
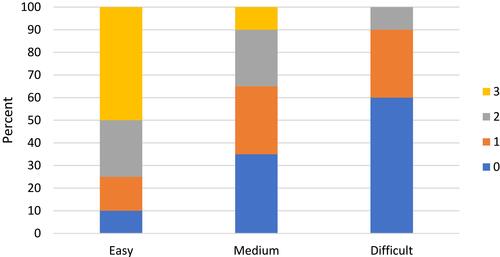
Figure 2 Comparison of frequency of correct responses to the difficulty level of terraces in the second group before and after using the checklist.
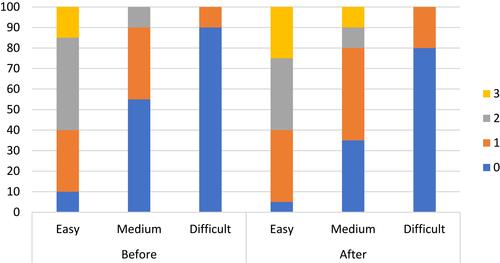
Table 3 Comparison of Favorable and Unfavorable Results Between First Group (with Checklists) and Second Group (Without Checklists)
Table 4 Number of Second Group Participants with Favorable and Unfavorable Answers Before and After Using Checklists