
Figures & data
Figure 1 Saudi MEDs framework.

Table 1 Demographics Of Participants In The Virtual Reality And Conventional Based Groups (n=169)
Table 2 Age And Gender Distribution Under Virtual And Conventional Lectures
Figure 2 Bar chart, levels of agreement on perceptions of technology in education.
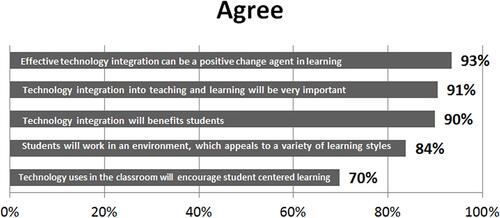
Figure 3 Bar chart, levels of agreement on perceptions of virtual technology education.
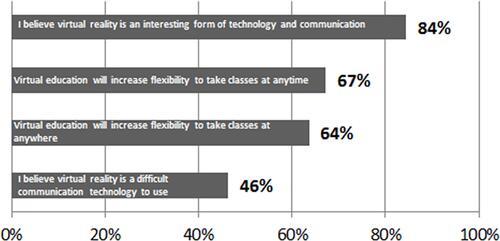
Figure 4 Bar chart, levels of agreement on perceptions of affordance.
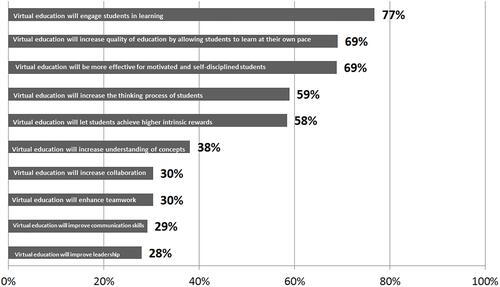
Figure 5 Bar chart, levels of agreement on perceptions of opportunities.
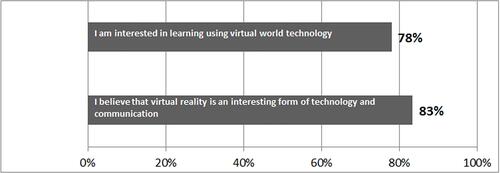
Table 3 Scores Of Participants In The Virtual Reality And Conventional Groups
Table 4 Satisfaction Level Of Participants In The Virtual Reality Group (n=51)