
Figures & data

Table 1 Descriptive Statistics With Pooled Midterm Samples
Figure 1 Scatter plot presents the positive linear correlation between the score of first Professional assessment and class attendance (R2 = 0.397, p < 0.05).
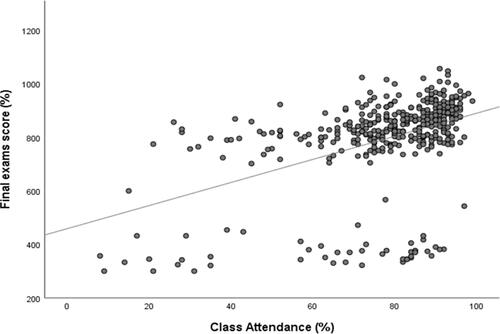
Figure 2 Scatter plot presents the positive linear correlation between the score of 2nd Professional assessment and class attendance (R2 = 0.198, p < 0.05).
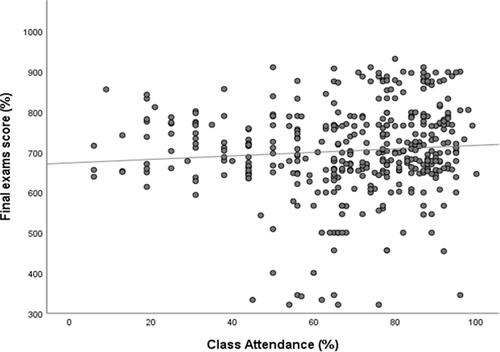
Table 2 Association Between Academic Performance And Absenteeism Score
Table 3 Overall Grade Determinants. Ordinary Least Squares (OLS) Estimates
Table 4 Effects Of Attendance On Final Grades Of RLMC. Panel Data Estimates