
Figures & data
Figure 1 Illustration of the inductive comparative analysis process.
Note: 1KolbCitation15;2WengerCitation9; 3Hägg Martinell et alCitation6; 4Hägg Martinell et al.Citation10
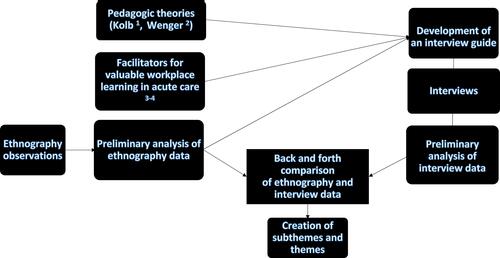
Table 1 Identified Themes and Subthemes
Figure 1 Illustration of the inductive comparative analysis process.
Note: 1KolbCitation15;2WengerCitation9; 3Hägg Martinell et alCitation6; 4Hägg Martinell et al.Citation10
Table 1 Identified Themes and Subthemes