Figures & data
Figure 1 Blueprint for assessment of Nurse-Doctor Co-Teaching sessions. Timeline highlighting the two-week interval between the Kickoff Dinner and first co-teaching session and the three-month interval between the pre- and post- Collaboration Surveys given to nurses and residents. Each of the ten Nurse-Doctor Co-Teaching sessions was evaluated by an overall rating survey.
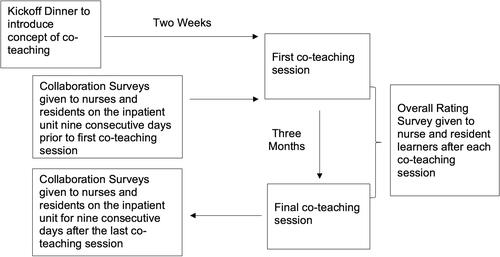
Table 1 Responses from Anonymous Nurse and Resident Learner Surveys after Each Nurse-Doctor Co-Teaching Session
Table 2 Topics of the Ten Co-Teaching Sessions and the Number and Types of Interactive Teaching Strategies Used in Each Session
Table 3 Description of the Interactive Teaching Strategies Used in Nurse-Doctor Co-Teaching Sessions
Table 4 Verbatim Comments from Anonymous Nurse and Resident Learner Surveys on What the Learners Liked Best about the Co-Teaching Session, Organized by Top Seven Categories of Response
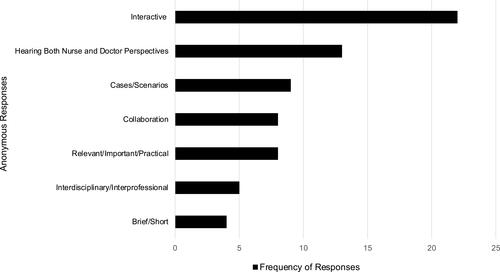
Figure 2 Top anonymous nurse and resident responses to the question “What did you like best about today’s session?” Responses are from nurse and resident learner surveys collected after each Nurse-Doctor Co-Teaching session, where n = 8 to 17 surveys depending on the session. Categories of anonymous responses are listed on the Y axis. Frequency of responses (X axis) represents the number of survey responses in each category totaled over the ten co-teaching sessions.