
Figures & data
Table 1 Demographic and Educational Profiles of the Respondents Who Participated in the Current Study
Table 2 Comparison Between the Traditional MBBCH and Integrated MSBP-CB Systems Regarding Mean Total DREEM and Its Subscales’ Scores
Table 3 Level of Scores of the DREEM Inventory and Its Subscales Among Participants Enrolled in Both Systems and Recruited in the Current Study
Figure 1 Comparing the traditional MBBCH and the integrated MSBP-CB systems regarding mean total DREEM and its subscale scores.
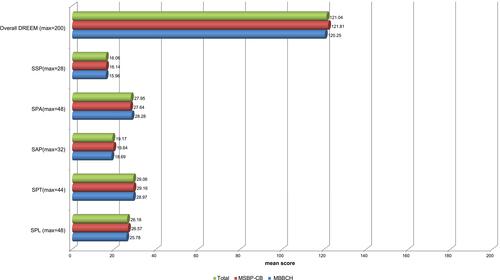
Table 4 Comparison Between the Traditional MBBCH and Integrated MSBP-CB Systems Regarding the Mean Item Scores
Figure 2 Items that differed significantly between the traditional MBBCH and the integrated MSBP-CB systems in terms of mean item scores.
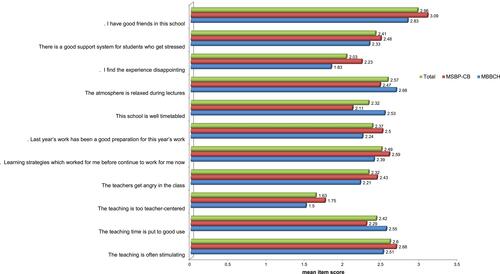
Table 5 Mean Score of DREEM Inventory and Its Subscales Based on Gender in Both Study Groups
Figure 3 Comparing the traditional MBBCH and the integrated MSBP-CB systems regarding the mean student’s perceptions of teacher (SPT) score based on gender.
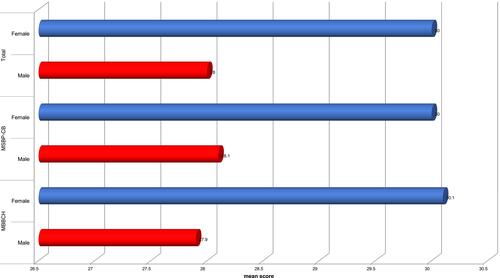
Table 6 Mean Score of DREEM Inventory and Its Subscales Based on Age in Both Study Groups
Figure 4 Comparing the traditional MBBCH and the integrated MSBP-CB systems regarding the mean scores of SAP, SPT, and SPL based on age.
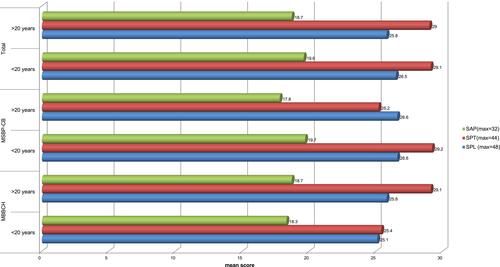
Table 7 Mean Score of DREEM Inventory and Its Subscales Based on the Previous Year’s GPA in Both Study Groups
Table 8 Correlation Between Score of DREEM and Its Subscales, Age and Previous Year GPA in Both Studied Groups
Figure 5 Comparing the traditional MBBCH and the integrated MSBP-CB systems regarding the mean score of SAP, SPT, SPL, and overall DREEM based on the previous year’s GPA.
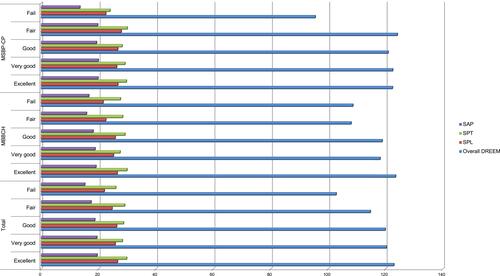
Table 9 Positive Points and Problematic Areas in the Learning Environment as Illustrated by the Mean Item Scores
Table 10 Spearman Correlation Coefficients Between Score of DREEM and Its Subscales, Among Studied Groups
Table 11 Comparison Between the Traditional MBBCH and Integrated MSBP-CB Systems Regarding the Achievements of Students
Figure 6 Comparing the traditional MBBCH and the integrated MSBP-CB systems regarding the achievements of students.
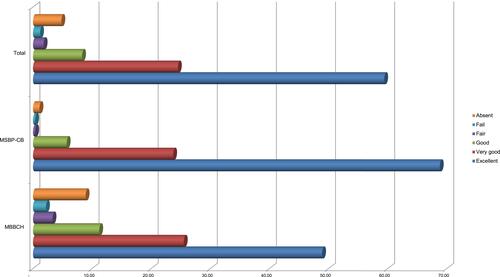
Table 12 Summary of the Selected Studies Showing Medical Students’ Perceptions Using the DREEM Inventory at National and Worldwide Levels from 2008 to 2021