
Figures & data
Table 1 Demography and Characteristics of Participants
Figure 1 Number of hours spent weekly on online learning and teaching prior and during the Covid-19 Pandemic. N = 425; P ‹ 0.01.
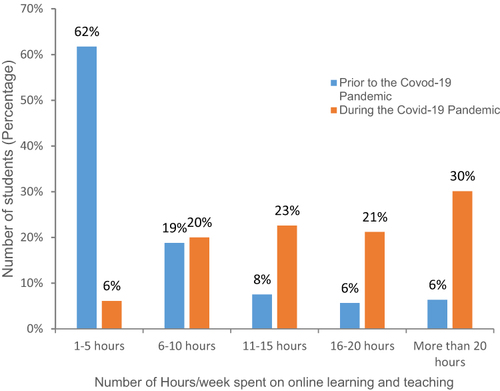
Table 2 Assessment of Platforms’ Effectiveness
Table 3 Assessment of Platforms’ Interaction Level
Table 4 Respondents’ Perceptions Towards Online Learning and Teaching Experiences
Figure 2 (A–C) Understanding scientific materials delivered online vs actual classroom. Comparison 2nd–3rd (preclinical years) vs 4th–6th (clinical years) students. (A) PBL/CBL. (P=0.113) (B) Theoretical lectures. (P ‹ 0.001) (C) Practical/clinical lectures. (P = 0.449).
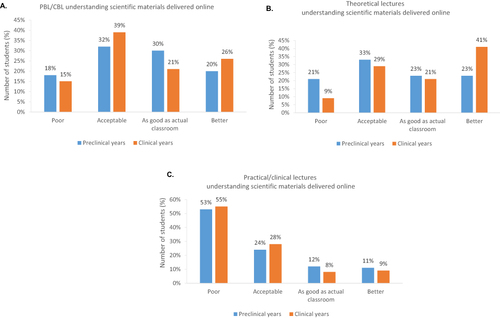
Table 5 Enjoyable Aspects of and Barriers to Online Learning and Teaching
Table 6 Impacts of Online Learning and Teaching on Students’ Health and Social Life Comparison 2nd–3rd vs 4th–6th Students
Data Sharing Statement
Data of this study are available upon request from the corresponding author.