
Figures & data
Figure 1 Flow chart of the inclusion of participating hospitals, wards, and supervisors.
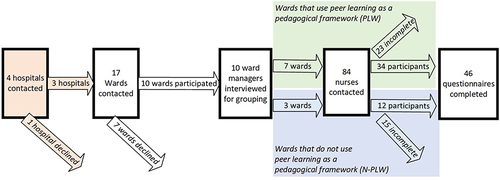
Table 1 Summary of Questions in the Questionnaire Distributed for Pilot Testing
Figure 2 Orthogonal Projections to Latent Structures Discriminant Analysis plot (OPLS-DA), with circles representing the participants from the peer learning wards (PLW, black) and non-peer learning wards (N-PLW, white). Ellipse: Hotelling’s T2 (95%).
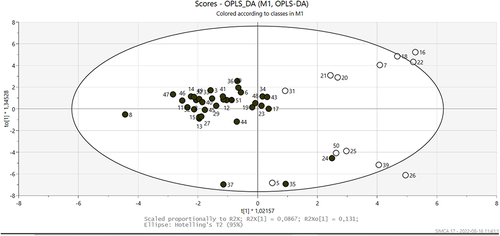
Figure 3 Variable Importance in Projection plot (VIP) with a value greater than 1.0. VIP value on the x-axis with confidence intervals in black.

Table 2 Summary of Basic Statistics Comparing PLW and N-PLW from the Pilot Results