
Figures & data
Table 1 Sociodemographic Variables of Dental Students at a Peruvian University
Figure 1 Absolute and relative frequency of dental students’ level of satisfaction with virtual classes.
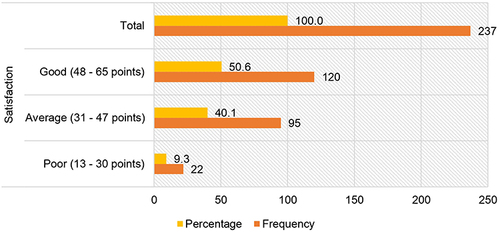
Table 2 Level of Satisfaction About Virtual Classes Associated with Students’ Sociodemographic Factors
Table 3 Satisfaction Scale of Dental Students’ Virtual Classes Associated with Their Sociodemographic Variables
Table 4 Multivariable Logistic Regression Model of Dental Students’ Satisfaction with Virtual Classes According to Their Sociodemographic Factors