Figures & data
Table 1 HER2 breast cancer cell-line panel
Figure 1 Heat map of maximum cell-growth inhibition induced by the individual compounds in the various cell lines.
Notes: Cell responses were visualized as a heat map by using the R package Gplots, where relative cell viability at the maximum compound concentration is plotted for each compound. Red indicates an effective compound (low cell viability), whereas yellow to white indicates little to no loss in viability (70%–100% viable cells). The compounds clustered into four groups based on the response, with cluster 1 being the least effective and cluster 4 the most effective growth inhibitors. ER status, black negative, white positive; PIK3CA-mutation status, white wild type, black mutated; PTEN status, black loss, white wild type.
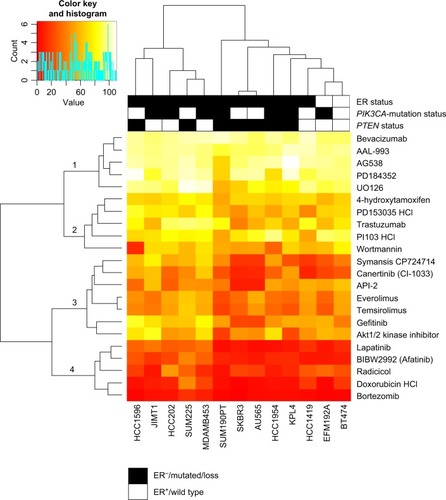
Figure 2 Cell lines divided into three groups based on response to trastuzumab and lapatinib.
Notes: (A) The cell lines were divided into three groups based on trastuzumab response: nonresponsive cell lines (blue), intermediate (<20% growth inhibition [GI], green) and responsive (>20% GI, pink). For this grouping, the most significantly differentiating concentration (0.52 µM, P<0.001) was used (the highest concentration has been left out of the graph). (B) The cell lines were divided into three groups based on the lapatinib response. The most significant differences between the groups were seen at 2 µM concentration (P<0.001). The three groups were less responsive (<50% GI, blue), intermediately responsive (60%–65% GI, green), and highly responsive (>75% GI, red) (highest concentration left out). ***P<0.001.
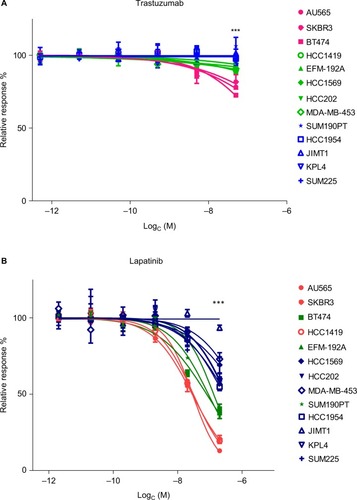
Figure 3 Box plots showing trastuzumab and lapatinib response in 13 HER2 positive cell lines relative to PIK3CA and PTEN status.
Notes: The x-axes show mutation status, where red is PIK3CA-mutated (Mut) and PTEN loss; blue is PIK3CA-Mut and PTEN wild type (WT); green is PIK3CA WT and PTEN WT. (A) The effects on trastuzumab response. The PIK3CA-Mut cell lines were more resistant than the WT to trastuzumab (P<0.001 for the second- and third-highest concentrations [left and right panel, respectively]). PTEN loss in addition to Mut PIK3CA increased resistance to trastuzumab (P<0.001 for the second and third concentrations). (B) Effects on lapatinib response. Cell lines with Mut PIK3CA were significantly more resistant to lapatinib (P<0.001 for second- and third-highest concentrations) than the rest. PTEN loss did not show any additional effect on lapatinib response. ***P<0.001.
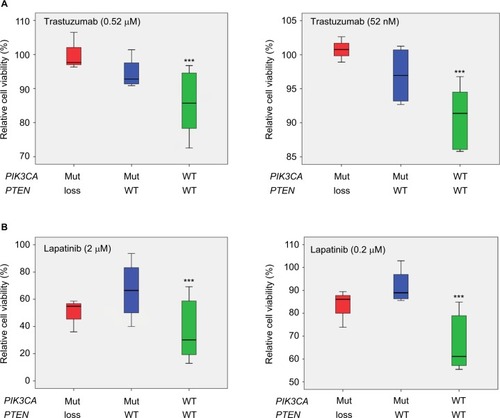
Figure 4 Akt1/2 kinase-inhibitor response.
Notes: (A) Cell viability. Two cell lines KPL4 (trastuzumab nonresponsive, lapatinib less responsive) and SUM190PT (trastuzumab nonresponsive, lapatinib intermediate) showed significant growth inhibition at the two highest concentrations of the Akt1/2 inhibitor (***P<0.001). (B) Western blot analysis. pAkt, total Akt, pMAPK8, total MAPK8, and α-tubulin levels in HCC1954, KPL4, MDA-MB-453, and SUM190PT cells treated with the Akt1/2 kinase inhibitor. All four cell lines showed a decrease in the level of pAkt upon treatment with the inhibitor. However, HCC1954 still had detectable pAkt after 24 hours of treatment, which could explain the resistance. (C) Induction of apoptosis. Cells were incubated with Akt1/2 kinase inhibitor for 2 days and apoptosis was measured. MDA-MB-453 and SUM190PT showed induced apoptosis, whereas KPL4 and HCC1954 did not.
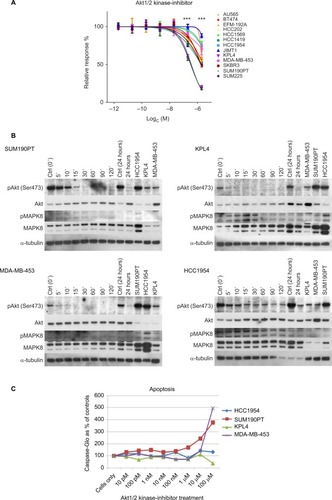
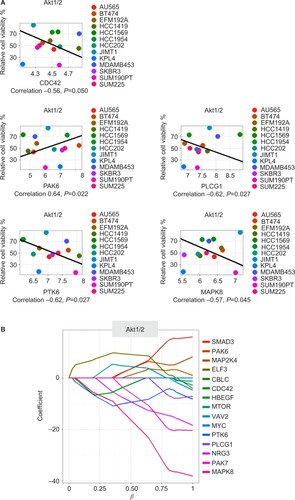
Figure 5 The five drug–gene associations found by both Spearman’s correlation and through elastic-net analysis for the Akt1/2 kinase inhibitor.
Notes: (A) Correlation plots. The x-axes show gene expression in log2 scale. (B) Elastic-net plot. The x-axis shows the effect of the predictor (gene) and the amount of predictors at a certain cutoff. The y-axis shows the effect on cell viability of the predictor (gene), where a positive value indicates more viability and less response, and a negative value indicates less viable cells and better response to the compound.