
Figures & data
Figure 1 Kaplan–Meier curves for patients with breast cancer.
Notes: The green line represents the cumulative disease-free survival of 83 statin users, while the blue line represents cumulative disease-free survival of 527 non-statin users.
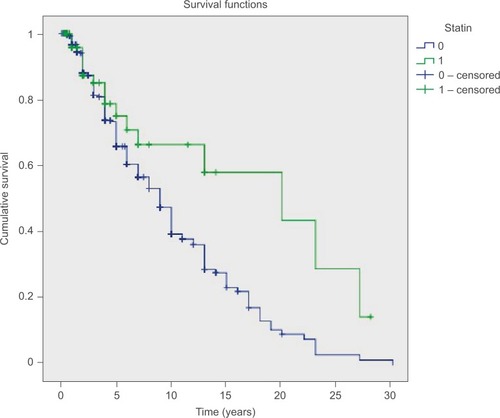
Figure 2 Kaplan–Meier curves displaying proportion of patients at risk over time.
Notes: The green line represents the 83 statin users, while the blue line represents the 527 non-statin users.
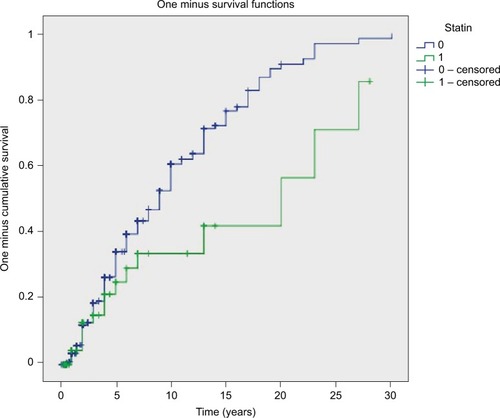
Table 1 Baseline patient characteristics among statin users and non-statin users
Table 2 Cox proportional HR-model results of statin effect, after adjusting for various parameters
Table 3 Cox proportional HR-model results of statin effect when only patients under the median age were included in the analysis
Table 4 Cox proportional HR-model results of statin effect when only patients with hormone receptor-positive tumors were included in the analysis