
Figures & data
Table 1 Primers for real-time polymerase chain reaction analysis
Table 2 Sequences for small interfering RNA analysis
Figure 1 Expression levels of HMMR-AS1 (RP11-80G.1) long noncoding RNA were analyzed by RT-qPCR in 52 breast cancer tissue samples. (A) Expression levels of HMMR in breast cancer tissues were found by RT-qPCR to be significantly lower than those in adjacent normal tissues. (B) The expression levels of HMMR were significantly correlated with those of HMMR-AS1 (RP11-80G.1) lncRNA (R=0.802, P<0.0001). *Maximum value; □ mean value.
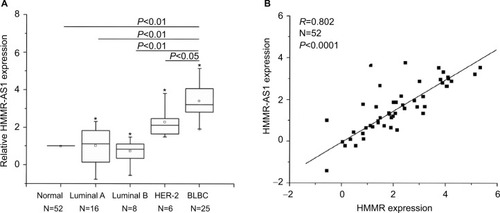
Figure 2 The expression levels of HMMR mRNA and HMMR-AS1 long noncoding RNA in (A) MDA-MB-231 and (B) MDA-MB-468 cells after siRNA transfection. The results showed that the expression levels of HMMR-AS1 and HMMR were significantly reduced in HMMR-AS1 siRNA groups. *P<0.05 compared with the siRNA control group.
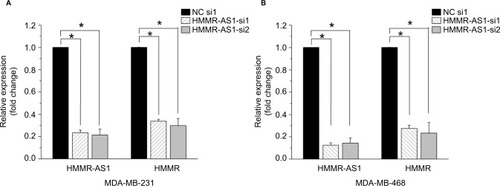
Figure 3 Effects of HMMR-AS1 knockdown on the proliferation of MDA-MB-231 and MDA-MB-468 cells. HMMR-AS1 siRNAs evidently inhibited the growth of (A) MDA-MB-231 and (B) MDA-MA-468 compared with NC siRNA in an MTS assay (*P<0.05).
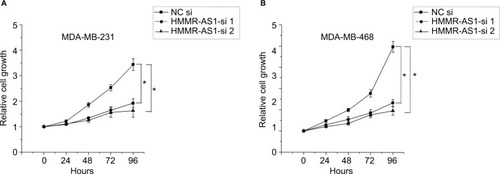
Figure 4 Effects of HMMR-AS1 knockdown on the migration ability of MDA-MB-231 and MDA-MB-468 cells. The capacity of cell invasion in the (A) MDA-MB-231 and (B) MDA-MB-468 cells was apparently impaired by HMMR-AS1 siRNA. *P<0.05 compared with that of the NC siRNA control.
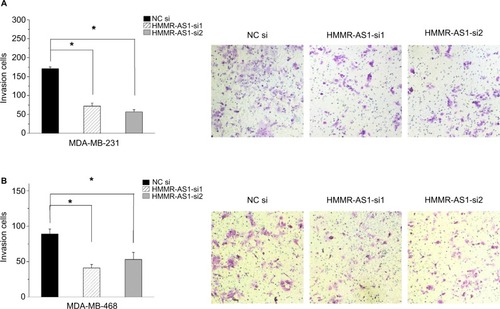
Table 3 Correlations of HMMR-AS1 with other cancer-related genes