Figures & data
Figure 1 Heat map of TRP channel expression in 11 native human breast cancer tissues and four healthy breast tissues.
Notes: (A) Heat map shows FPKM values for the different TRP channels expressed in 11 breast cancer tissues. RNA-Seq data were generated in cooperation with the CCG. FPKM values are visualized by different colors. The expression level correlates with the color depth. TRP channels are sorted by the sum of their expression values across all tissues. (B) Heat map shows FPKM values for the different TRP channels expressed in four healthy breast tissues.
Abbreviations: CCG, Cologne Center for Genomics; FPKM, fragments per kilobase of exon per million fragments mapped; TRP, transient receptor potential.
Abbreviations: CCG, Cologne Center for Genomics; FPKM, fragments per kilobase of exon per million fragments mapped; TRP, transient receptor potential.
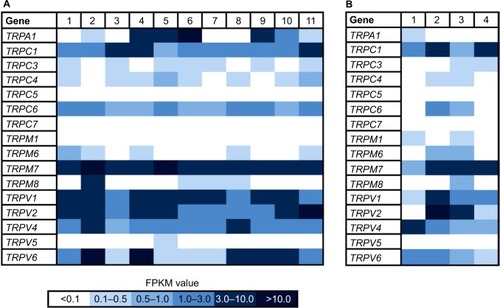
Figure 2 Heat map of TRP channel expression in 49 breast cancer cell lines and healthy tissues.
Notes: (A) Breast cancer cell lines derived from tumors with mutated BRCA1 genes; n = 3. (B) Breast cancer cell lines derived from basal-like breast tumors; n = 15. (C) Breast cancer cell lines derived from luminal breast tumors; n = 23. (D) Breast cancer cell lines derived from triple-negative breast tumors; n = 8. (E) Expression of the 16 TRP channels observed in healthy breast tissues (n = 214, data obtained from Gtex, www.gtexportal.org). FPKM values are visualized by different colors. The expression level correlates with the color depth.
Abbreviations: FPKM, fragments per kilobase of exon per million fragments mapped; TRP, transient receptor potential.
Abbreviations: FPKM, fragments per kilobase of exon per million fragments mapped; TRP, transient receptor potential.
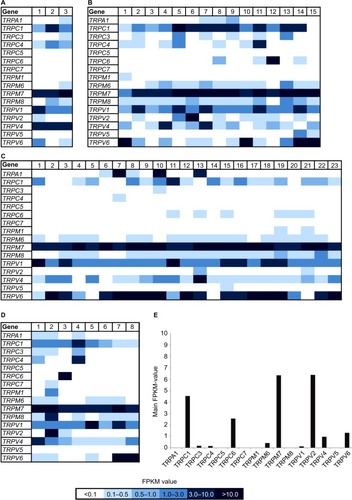
Figure 3 Expression of TRPV1 in breast cancer tissues and cell lines.
Notes: (A) Comparison of expression of TRPV1 in all breast cancer subtypes investigated. (B) Read coverage of TRPV1 detected in one of the breast cancer tissue samples and visualized by the Integrative Genomic Viewer. (C) Validation of TRPV1 expression in five breast cancer tissue samples via RT-PCR. +, +RT, cDNA; −, −RT, RNA; gDNA, genomic DNA as a control.
Abbreviations: BC, breast cancer; M, marker; PCR, polymerase chain reaction; RT, reverse transcriptase; TNBC, triple-negative breast cancer.
Abbreviations: BC, breast cancer; M, marker; PCR, polymerase chain reaction; RT, reverse transcriptase; TNBC, triple-negative breast cancer.
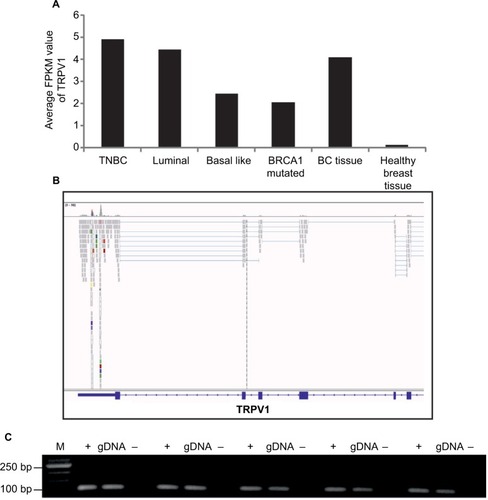
Figure 4 Expression profiles of TRP channels in the SUM149PT breast cancer cell line.
Notes: (A) NGS-based RNA-Seq analysis of the expression of TRP channels. (B) Validation of the expression of TRPV1 in SUM149PT cells via RT-PCR. +, +RT, cDNA; −, −RT, RNA; g, genomic DNA as a control. (C) Immunocytochemical staining of SUM149PT cells with specific TRPV1 antibodies. Left: SUM149PT cells. Right: Negative control: SUM149PT cells stained with secondary antibody alone. Staining of the cell nuclei was performed using DAPI (blue). Scale bar: 10 µm.
Abbreviations: DAPI, 4′,6-diamidino-2-phenylindole; M, marker; NGS, next-generation sequencing; PCR, polymerase chain reaction; RT, reverse transcriptase; TRP, transient receptor potential.
Abbreviations: DAPI, 4′,6-diamidino-2-phenylindole; M, marker; NGS, next-generation sequencing; PCR, polymerase chain reaction; RT, reverse transcriptase; TRP, transient receptor potential.
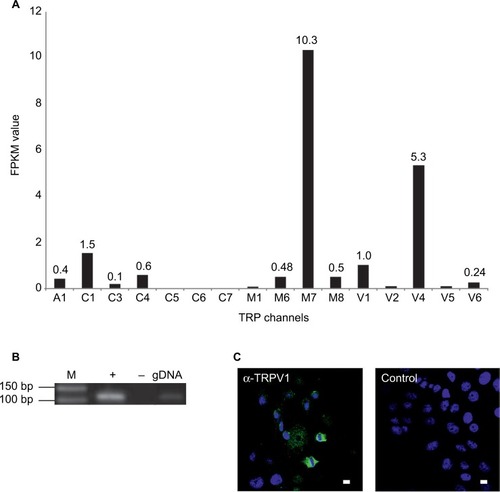
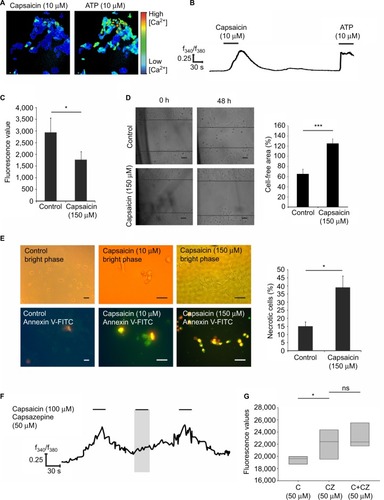
Figure 5 Functional characterization of TRPV1 activation by capsaicin in SUM149PT cells.
Notes: (A) Representative image of SUM149PT cells stimulated with capsaicin (10 µM) in calcium imaging analysis. To ensure the viability of the cells, ATP (10 µM) was applied finally and served as a positive control. N > 3 with n = 12 measurements in six cell culture dishes with ~200 cells. (B) Activation of SUM149PT cells upon repetitive capsaicin application (10 µM). (C) Analysis of cell proliferation via CyQuant proliferation assay after capsaicin stimulation for 48 h (150 µM); n = 20. (D) Analyses of cell migration by scratch assay after capsaicin (150 µM) stimulation for 48 h. Bar chart showing statistical analysis of the area overgrown in scratch assay experiments; n = 3 assays. (E) Annexin V-FITC staining of SUM149PT cells stimulated by capsaicin (10 and 150 µM). Early apoptotic cells (Annexin V positive, PI negative) are shown in green; necrotic cells (Annexin V positive, PI positive) are shown in yellowish-red, and viable cells are shown in bright phase (Annexin V negative, PI negative). Bar chart showing statistical analysis of cells undergoing necrosis; n = 3 stains of five slices with ~300 cells. (F) Calcium signal upon application of capsaicin (100 µM) and capsaicin (100 µM) + capsazepin (50 µM); n = 6 cell culture dishes with ~200 cells. The shaded area represents the application of the antagonist capsazepin. (G) Analysis of the cell proliferation via CyQuant proliferation assay after capsaicin (50 µM) and capsaicin (50 µM) + capsazepin (50 µM) stimulation for 48 h; n = 10. *P<0.05, ***P<0.001. Scale bar = 10 µm.
Abbreviations: C, capsaicin; CZ, capsazepin; FITC, fluorescein isothiocyanate; PI, propidium iodide; F340/F380, ratio of the fluorescence intensities at 340 nm and 380 nm excitation; C, capsaicin; CZ, capsazepin; ATP, adenosine triphosphate; ns, not significant.
Abbreviations: C, capsaicin; CZ, capsazepin; FITC, fluorescein isothiocyanate; PI, propidium iodide; F340/F380, ratio of the fluorescence intensities at 340 nm and 380 nm excitation; C, capsaicin; CZ, capsazepin; ATP, adenosine triphosphate; ns, not significant.