Figures & data
Table 1 Demographics of patients studied
Table 2 Discordance between paired primary lesion and first and second metastases
Figure 1 Survival curve based on the estrogen receptor (ER) status. There was a significant difference in survival, with the best survival noted in patients with biomarkers positive at all three time points. Worse survival was witnessed for those patients with all three parameters negative, and intermediate survival for those with discordant tumors (chi-square =14.27, p=0.0008).
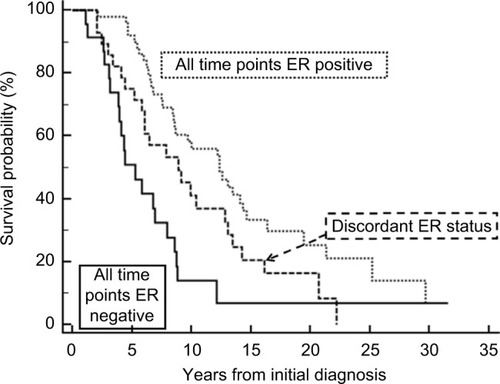
Figure 2 Survival curve based on the progesterone receptor (PR) status. Again there was a significant difference between the survival curves (chi-square =11.31, p=0.0035). In this case, patients with tumors negative for PR at all three time points experienced a worse survival probability, whereas survival was similar for the other two situations.
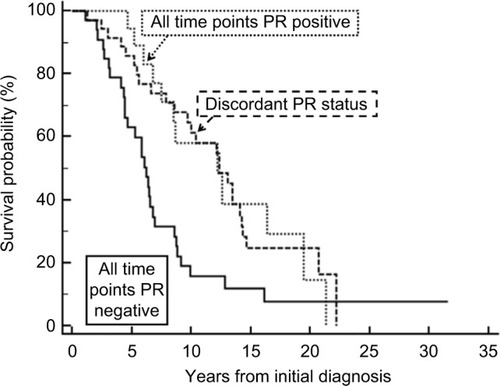
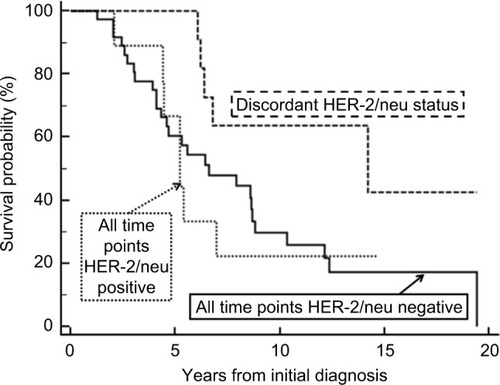
Figure 3 Demonstrates the survival curves for the three scenarios based on HER-2/neu status. In contrast to hormone receptor discordance, there was no difference in survival for the three HER-2/neu concordant or discordant groups (chi-square=4.66, p=0.972).