Figures & data
Figure 1 RO decreases MPA-induced CD44 protein expression in hormone-dependent human breast cancer cells.
Notes: T47-D (A) and BT-474 (B) cells were treated at 37°C for 24 hours with 10 nM MPA, 10 nM MPA +10 µM RO, or 10 µM RO alone in 5% DCC-treated FBS–DMEM/F12. Cells were labeled with CD44-APC and CD24-PE antibodies and analyzed using flow cytometry. Equal numbers of cells were analyzed in each treatment group. Bar graphs quantitate CD44 expression. Bars represent mean ± SEM (n=3); fold change is compared with control value (set at 1). *Significantly different compared with controls. **Significantly different compared with MPA-induced CD44 expression (ANOVA; P<0.05).
Abbreviations: ANOVA, analysis of variance; APC, allophycocyanin; DCC, dextran-coated charcoal; FBS, fetal bovine serum; MPA, medroxyprogesterone acetate; PE, phycoerythrin; RO, RO 48-8071; SEM, standard error of the mean.
Abbreviations: ANOVA, analysis of variance; APC, allophycocyanin; DCC, dextran-coated charcoal; FBS, fetal bovine serum; MPA, medroxyprogesterone acetate; PE, phycoerythrin; RO, RO 48-8071; SEM, standard error of the mean.
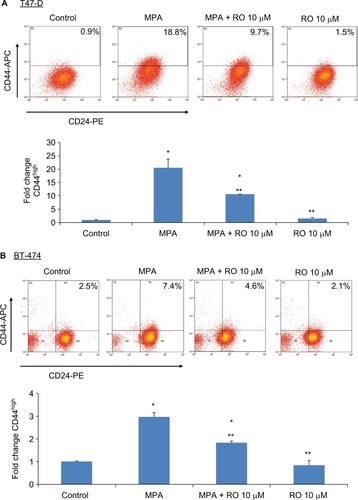
Figure 2 RO decreases PR protein expression but not PR mRNA expression in T47-D cells.
Notes: (A and B) T47-D cells were treated at 37°C for 24 hours with 10 µM RO in 5% DCC-treated FBS–DMEM/F12. (A) Whole-cell extracts were prepared and subjected to Western blotting. β-Actin was used as a loading control. A representative blot is shown. (B) Bar graphs quantitate Western blot data. Bars represent mean ± SEM (n=4); percent expression normalized with β-actin is compared with control value (set at 100%). *Significantly different compared with controls (Student t-test; P<0.05). (C and D) T47-D cells were treated at 37°C for 6 hours with 10 or 25 µM RO in 5% DCC-treated FBS–DMEM/F12. RNA was isolated from these cells and analyzed by RT-PCR for PR and GAPDH mRNA expressions. PCR products were then subjected to electrophoresis on ethidium bromide agarose gels. (D) Bar graphs quantitate PCR product data normalized with GAPDH expression. Bars represent mean ± SEM (n=7); fold change is compared with control value (set at 1). No significant difference was found between groups (ANOVA; P>0.05).
Abbreviations: ANOVA, analysis of variance; DCC, dextran-coated charcoal; FBS, fetal bovine serum; GAPDH, glyceraldehyde-3-phosphate dehydrogenase; PCR, polymerase chain reaction; PR, progesterone receptor; RT-PCR, reverse transcription-PCR; RO, RO 48-8071; SEM, standard error of the mean.
Abbreviations: ANOVA, analysis of variance; DCC, dextran-coated charcoal; FBS, fetal bovine serum; GAPDH, glyceraldehyde-3-phosphate dehydrogenase; PCR, polymerase chain reaction; PR, progesterone receptor; RT-PCR, reverse transcription-PCR; RO, RO 48-8071; SEM, standard error of the mean.
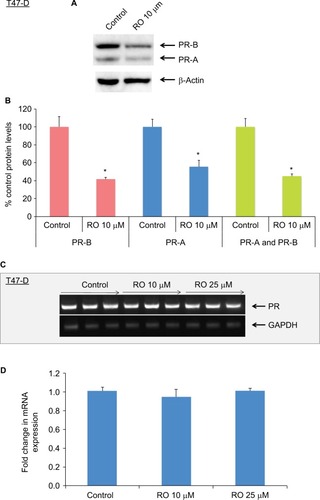
Figure 3 RO reduces PR protein expression in T47-D cells in a ubiquitination-dependent manner.
Notes: T47-D cells were treated at 37°C for 6 hours with 25 µM RO, 25 µM RO +1 µM MG-132, or 25 µM RO +2.5 µM MG-132 in 5% DCC-treated FBS–DMEM/F12. Whole-cell extracts were prepared and subjected to Western blotting. β-Actin was used as a loading control. A representative blot is shown, and the experiment was performed twice.
Abbreviations: DCC, dextran-coated charcoal; FBS, fetal bovine serum; PR, progesterone receptor; RO, RO 48-8071.
Abbreviations: DCC, dextran-coated charcoal; FBS, fetal bovine serum; PR, progesterone receptor; RO, RO 48-8071.
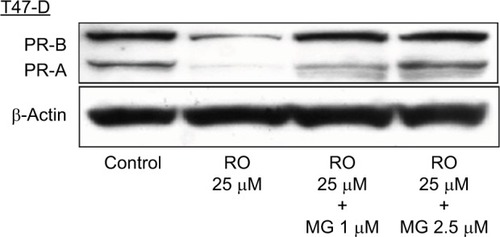
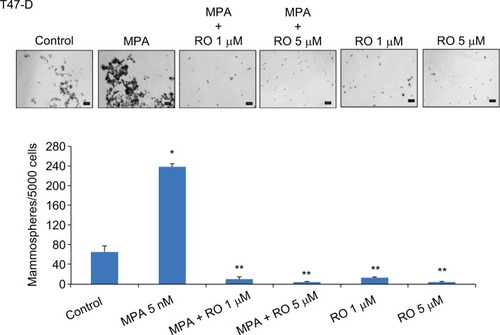
Figure 4 RO abolishes MPA-induced mammosphere formation by T47-D cells.
Notes: T47-D cells were pretreated at 37°C for 48 hours with 5 nM MPA. Cells were then subjected to the mammosphere assay with 5 nM MPA, 1 µM RO, 5 µM RO, 5 nM MPA +1 µM RO, or 5 nM MPA +5 µM RO in 5% DCC-treated FBS–DMEM/F12. Cells were retreated every 48 hours. Top panel, representative micrographs at day 5. Scale bar, 100 µm. Bottom panel, quantification of mammospheres formed. The number of mammospheres formed (100 mm) was counted after 5 days, and the number of mammospheres per 5000 cells was calculated. Bars represent mean ± SEM (n=3). *Significantly different compared with controls. **Significantly different compared with MPA and control groups (ANOVA, P<0.05).
Abbreviations: ANOVA, analysis of variance; DCC, dextran-coated charcoal; FBS, fetal bovine serum; MPA, medroxyprogesterone acetate; RO, RO 48-8071; SEM, standard error of the mean.
Abbreviations: ANOVA, analysis of variance; DCC, dextran-coated charcoal; FBS, fetal bovine serum; MPA, medroxyprogesterone acetate; RO, RO 48-8071; SEM, standard error of the mean.