Figures & data
Figure 1 Concentration-dependent effects of BC on ERα levels.
Notes: T-47D cells were cultured in RPMI-1640 medium supplemented with 10% FBS for 2 days followed by 6 days in media containing 5% DCC-stripped FBS with media changed every 48 hours. On the seventh day, cells were treated with BC for 24 hours at concentrations of 5–100 µM. Cellular protein extracts were prepared followed by protein quantification, SDS-PAGE, and Western blot analysis. The control lane, Cs, represents cells grown in the absence of ligands in media containing 5% DCC-stripped FBS. The relative intensity of ERα protein, as compared to Cs, is displayed as the mean ± SEM. The asterisk indicates significant difference with respect to the control. *p<0.05 (Kruskal–Wallis test followed by post hoc analysis using Mann–Whitney U test). Three independent experiments are displayed in the representative blots.
Abbreviations: BC, black cohosh; Cs, control; ERα, estrogen receptor-alpha; SEM, standard error of the mean; SDS, sodium dodecyl sulfate; PAGE, polyacrylamide gel electrophoresis; DCC, dextran-coated charcoal; FBS, fetal bovine serum.
Abbreviations: BC, black cohosh; Cs, control; ERα, estrogen receptor-alpha; SEM, standard error of the mean; SDS, sodium dodecyl sulfate; PAGE, polyacrylamide gel electrophoresis; DCC, dextran-coated charcoal; FBS, fetal bovine serum.
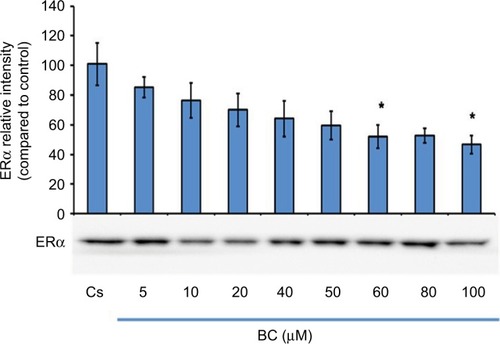
Figure 2 Concentration-dependent effects of BC on PR-A/B levels.
Notes: T-47D cells were cultured in RPMI-1640 medium supplemented with 10% FBS for 2 days followed by 6 days in media containing 5% DCC-stripped FBS with media changed every 48 hours. On the seventh day, cells were treated with BC for 24 hours at concentrations of 5–100 µM. Cellular protein extracts were prepared followed by protein quantification, SDS-PAGE, and Western blot analysis. The control lane, Cs, represents cells grown in the absence of ligands in media containing 5% DCC-stripped FBS. The relative intensity of PR-A/B protein, as compared to Cs, is displayed as the mean ± SEM. The asterisk indicates significant difference with respect to the control. ***p<0.001 (Kruskal–Wallis test followed by post hoc analysis using Mann–Whitney U test). Three independent experiments are displayed in the representative blots.
Abbreviations: BC, black cohosh; Cs, control; SEM, standard error of the mean; SDS, sodium dodecyl sulfate; PAGE, polyacrylamide gel electrophoresis; DCC, dextran-coated charcoal; FBS, fetal bovine serum; PR, progesterone receptor.
Abbreviations: BC, black cohosh; Cs, control; SEM, standard error of the mean; SDS, sodium dodecyl sulfate; PAGE, polyacrylamide gel electrophoresis; DCC, dextran-coated charcoal; FBS, fetal bovine serum; PR, progesterone receptor.
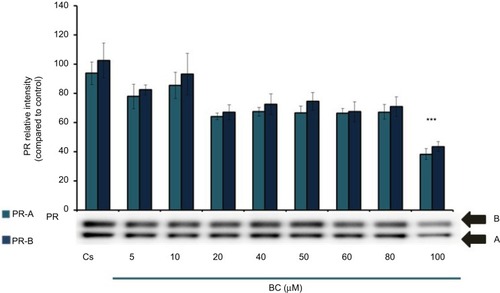
Figure 3 Concentration-dependent effects of BC on cell viability.
Notes: T-47D cells were cultured in 12-well plates containing ~30,000 cells per well. For 2 days, cells were maintained in 10% FBS media containing growth factors for growth. For the following 6 days, growth factor media were replenished with DCC-FBS media and treated with ligands at 2-day intervals over 6 days. The treatments consisted of 5–100 µM BC and were followed by a cell viability assay utilizing propidium iodide staining and image cytometry via the Nexcelom Cellometer Vision on the seventh day. *p<0.05 and ***p<0.001 (Kruskal–Wallis test followed by post hoc analysis using Mann–Whitney U test). Three independent experiments are displayed in the graph.
Abbreviations: BC, black cohosh; Cs, control; DCC, dextran-coated charcoal; FBS, fetal bovine serum.
Abbreviations: BC, black cohosh; Cs, control; DCC, dextran-coated charcoal; FBS, fetal bovine serum.
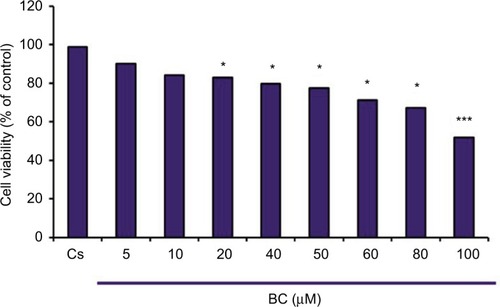
Figure 4 Effects of hormones and antihormones with BC on ERα levels.
Notes: T-47D cell cultures were prepared as stated in and . On the seventh day, cells were treated with or in combinations of 100 µM BC, 10 nM E2, 1 µM of pure ER antagonist, ICI, and 1 µM TAM and incubated for 24 hours. Treatment combinations are as follows: E2, ICI, E2 + ICI, BC, BC + E2, BC + ICI, TAM, BC + TAM, E2 + TAM. Cellular protein extracts were prepared followed by protein quantification, SDS-PAGE, and Western blot analysis. The control lane, Cs, represents cells grown in the absence of ligands in media containing 5% DCC-stripped FBS. The relative intensity of ERα protein, as compared to Cs, is displayed as the mean ± SEM. The asterisk indicates significant difference with respect to the control. *p<0.05 and ***p<0.001 (Kruskal–Wallis test followed by post hoc analysis using Mann–Whitney U test). Three independent experiments are displayed in the representative blots.
Abbreviations: BC, black cohosh; Cs, control; ERα, estrogen receptor-alpha; SEM, standard error of the mean; SDS, sodium dodecyl sulfate; PAGE, polyacrylamide gel electrophoresis; DCC, dextran-coated charcoal; FBS, fetal bovine serum; ICI, ICI 182, 780; TAM, Tamoxifen; E2, estradiol.
Abbreviations: BC, black cohosh; Cs, control; ERα, estrogen receptor-alpha; SEM, standard error of the mean; SDS, sodium dodecyl sulfate; PAGE, polyacrylamide gel electrophoresis; DCC, dextran-coated charcoal; FBS, fetal bovine serum; ICI, ICI 182, 780; TAM, Tamoxifen; E2, estradiol.
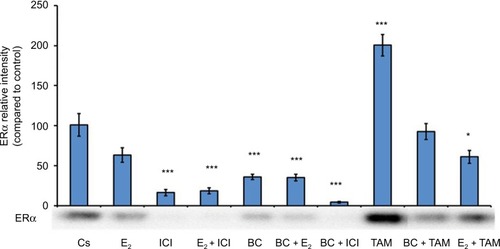
Figure 5 Effects of hormones and antihormones with BC on PR-A/B levels.
Notes: T-47D cell cultures were prepared as stated in and . On the seventh day, cells were treated for 24 hours with or in combinations of 100 µM BC, 10 nM E2, 1 µM of pure ER antagonist, ICI, and 1 µM TAM. Treatment combinations are as follows: E2, ICI, E2 + ICI, BC, BC + E2, BC + ICI, TAM, BC + TAM, E2 + TAM. Cellular protein extracts were prepared followed by protein quantification, SDS-PAGE, and Western blot analysis. The control lane, Cs, represents cells grown in the absence of ligands in media containing 5% DCC-stripped FBS. The relative intensity of PR-A/B protein, as compared to Cs, is displayed as the mean ± SEM. The asterisk indicates significant difference with respect to the control. *p<0.05 and ***p<0.001 (Kruskal–Wallis test followed by post hoc analysis using Mann–Whitney U test). Three independent experiments are displayed in the representative blots.
Abbreviations: BC, black cohosh; Cs, control; PR, progesterone receptor; ER, estrogen receptor; SEM, standard error of the mean; SDS, sodium dodecyl sulfate; PAGE, polyacrylamide gel electrophoresis; DCC, dextran-coated charcoal; FBS, fetal bovine serum; ICI, ICI 182, 780; TAM, Tamoxifen; E2, estradiol.
Abbreviations: BC, black cohosh; Cs, control; PR, progesterone receptor; ER, estrogen receptor; SEM, standard error of the mean; SDS, sodium dodecyl sulfate; PAGE, polyacrylamide gel electrophoresis; DCC, dextran-coated charcoal; FBS, fetal bovine serum; ICI, ICI 182, 780; TAM, Tamoxifen; E2, estradiol.
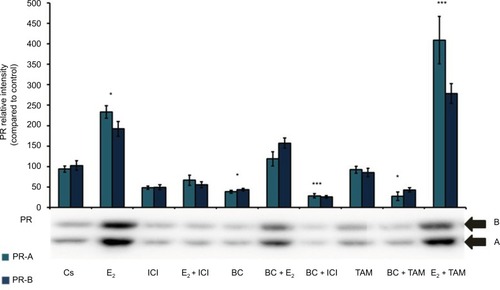
Figure 6 Effects of hormones and antihormones with BC on cell viability.
Notes: T-47D cells were cultured as mentioned in . The treatments, alone or in combination, consisted of 100 µM BC, 10 nM E2, 1 µM of pure ER antagonist, ICI, and 1 µM TAM. Treatment combinations are as follows: E2, ICI, E2 + ICI, BC, BC + E2, BC + ICI, TAM, BC + TAM, E2 + TAM. This was followed by a cell viability assay utilizing propidium iodide staining and image cytometry via the Nexcelom Cellometer Vision on the seventh day. ***p<0.001 (Kruskal–Wallis test followed by post hoc analysis using Mann–Whitney U test). Three independent experiments are displayed in the graph.
Abbreviations: BC, black cohosh; Cs, control; ER, estrogen receptor; ICI, ICI 182, 780; TAM, Tamoxifen; E2, estradiol.
Abbreviations: BC, black cohosh; Cs, control; ER, estrogen receptor; ICI, ICI 182, 780; TAM, Tamoxifen; E2, estradiol.
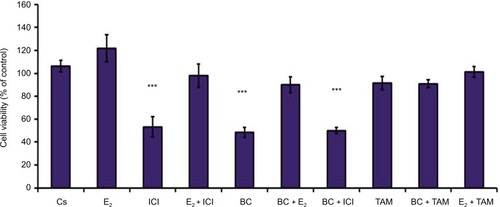
Figure 7 Effects of BC on ESR1 gene expression.
Notes: (A) The effect of BC, E2, and ICI alone and in combination on ESR1 mRNA levels in T-47D breast cancer cells was determined by RT-qPCR. T-47D cells were treated in the presence or absence of 100 µM BC, 10 nM E2, and/or 1 µM ICI for 24 hours. Results are shown as the mean ± SEM of at least three independent experiments with three replicates in each experiment. *p<0.05 (Kruskal–Wallis test followed by post hoc analysis using Mann–Whitney U test). (B) Calculation of PCR efficiencies. RT-qPCR efficiencies of reference ACTB and HPRT-1 genes and target gene (ESR1) were determined. Cq was plotted against the log amount of cDNA input. Amplification efficiencies were calculated according to the equation E = 10(−1/slope).
Abbreviations: BC, black cohosh; SEM, standard error of the mean; ICI, ICI 182, 780; E2, estradiol; RT-qPCR, reverse transcription quantitative real-time polymerase chain reaction; Cq, quantification cycle; DMSO, dimethyl sulfoxide; SYSR, SsoAdvanced SYBR Green Supermix.
Abbreviations: BC, black cohosh; SEM, standard error of the mean; ICI, ICI 182, 780; E2, estradiol; RT-qPCR, reverse transcription quantitative real-time polymerase chain reaction; Cq, quantification cycle; DMSO, dimethyl sulfoxide; SYSR, SsoAdvanced SYBR Green Supermix.
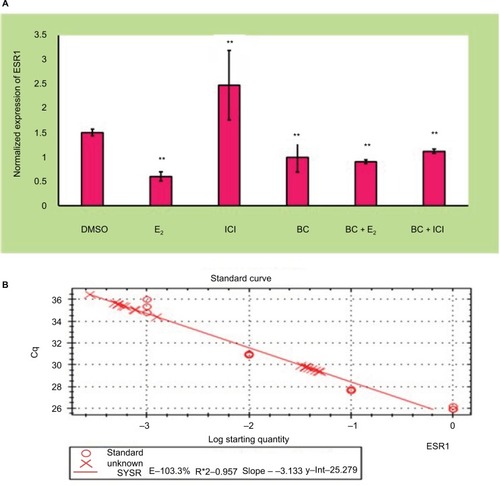
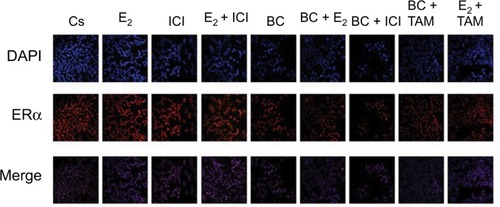
Figure 8 Effects of BC on the cellular localization of ERα.
Notes: Treated T-47D cells were grown in 12-well growth plates, each well containing ~30,000 cells on coverslips. The cells were sustained for 2 days in whole media containing 10% FBS. They were then withdrawn from endogenous growth factors by culturing in DCC-FBS for 6 days. E2, ICI, BC, and TAM were added in 2-day intervals alone or in combination for a period of 6 days. Cells were treated with Cy3 (red) and DAPI (blue) immunofluorescent stains and the cytolocalization of ERα protein was determined using confocal microscopy.
Abbreviations: BC, black cohosh; Cs, control; ERα, estrogen receptor-alpha; DCC, dextran-coated charcoal; FBS, fetal bovine serum; ICI, ICI 182, 780; TAM, Tamoxifen; E2, estradiol.
Abbreviations: BC, black cohosh; Cs, control; ERα, estrogen receptor-alpha; DCC, dextran-coated charcoal; FBS, fetal bovine serum; ICI, ICI 182, 780; TAM, Tamoxifen; E2, estradiol.