Figures & data
Figure 1 Protocol for treatment of tumor xenografts in nude mice with APR-246 and 2aG4.
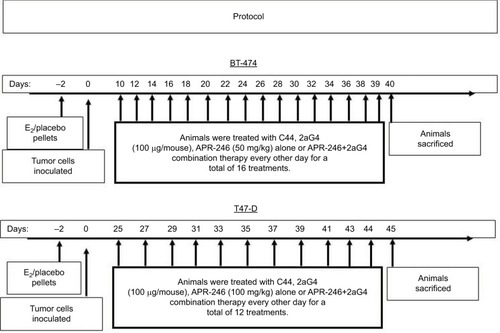
Figure 2 APR-246 and PRIMA-1 reduce cell viability of mtp53-expressing breast cancer cells.
Abbreviations: FBS, fetal bovine serum; mtp53, mutated form of p53; SEM, standard error of the mean; SRB, sulforhodamine B.
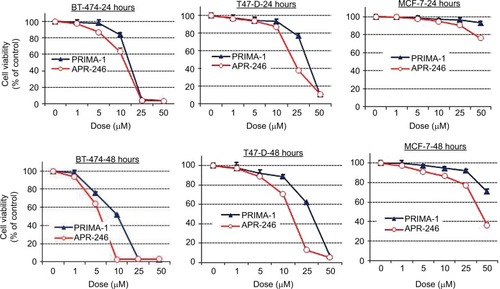
Table 1 IC50s (in μM) of APR-246 and PRIMA-1
Figure 3 APR-246 increases DNA binding of mtp53 in BT-474 breast cancer cells.
Abbreviations: ANOVA, analysis of variance; FBS, fetal bovine serum; mtp53, mutated form of p53; SEM, standard error of the mean.
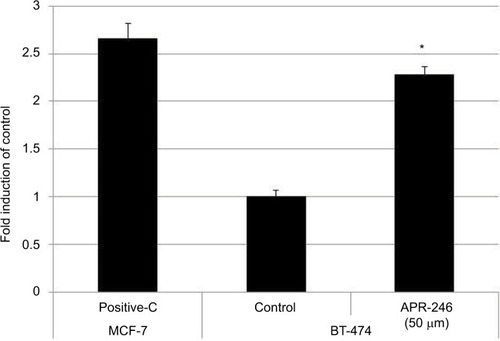
Figure 4 APR-246 induces apoptosis in BT-474 breast cancer cells.
Abbreviations: ANOVA, analysis of variance; Con, control; FBS, fetal bovine serum; FITC, fluorescein isothiocyanate; PI, propidium iodide; SEM, standard error of the mean.
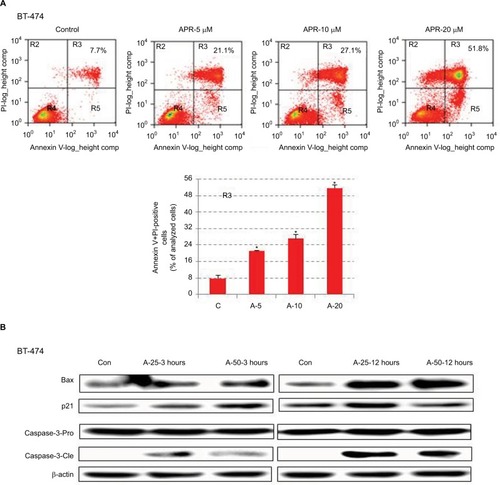
Figure 5 APR-246 and 2aG4 exert additive inhibitory effects on BT-474 tumor xenograft growth in nude mice.
Abbreviations: ANOVA, analysis of variance; SEM, standard error of the mean.
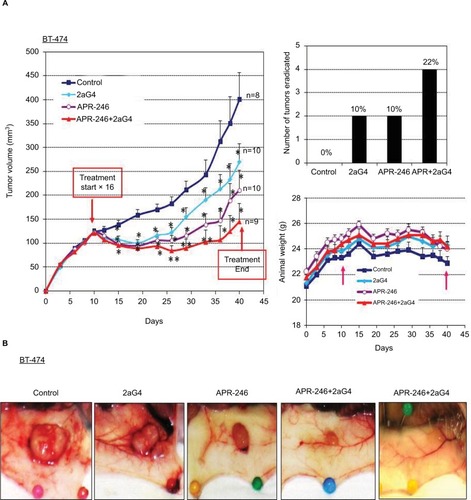
Figure 6 APR-246 and 2aG4 exert additive inhibitory effects on T47-D tumor xenograft growth in nude mice.
Abbreviations: ANOVA, analysis of variance; SEM, standard error of the mean.
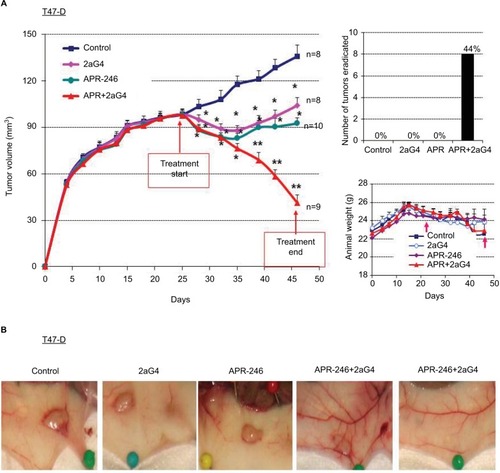
Figure 7 APR-246 and 2aG4 combination treatment reduces the expression of Ki67 proliferation markers in breast tumor xenografts in nude mice.
Abbreviations: ANOVA, analysis of variance; SEM, standard error of the mean.
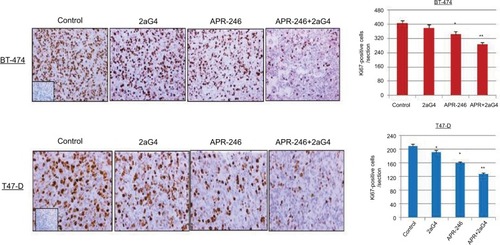
Figure 8 APR-246 and 2aG4 combination treatment induces apoptosis in breast tumor xenografts in nude mice.
Abbreviations: ANOVA, analysis of variance; SEM, standard error of the mean; TUNEL, terminal dUTP-mediated nick end labeling.
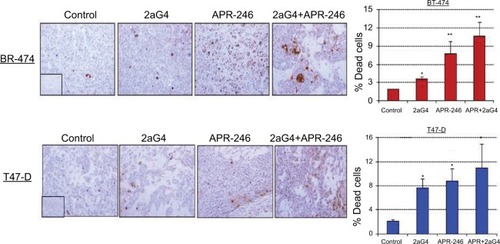
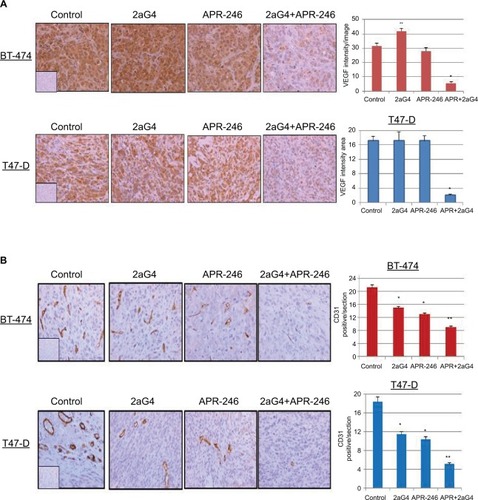
Figure 9 APR-246 and 2aG4 combination treatment reduces angiogenesis markers in breast tumor xenografts in nude mice.
Abbreviations: ANOVA, analysis of variance; SEM, standard error of the mean; VEGF, vascular endothelial growth factor.